


We’re seeing encouraging purchase signals this week even as mortgage rates have stabilized around 7%. Available inventory of unsold single family homes rose 2% this week; last year it rose 6% in this week.
The price of homes going into contract is also holding up, while last year at this time the few homes getting offers were doing so at lower prices.
This is a dramatically different housing market than it was a year ago.
This tells us two things. First, homebuyers may be more sensitive to rapid changes in mortgage rates than they are to the absolute levels. When the rates are stable for a while, buyers settle into what they can buy. When the rates change abruptly, suddenly as a home shopper, my calculations all change and I stop.
Second, the year-over-year comparisons start to get much easier in the data from here on out. We’ll start to see inventory decline year over year, prices appreciate year over year, fewer price reductions from last year. And, if we’re lucky, by the fall, we’ll see more home sales than last year.
Every week Altos Research tracks every home for sale in the country. We analyze all the pricing, supply and demand, and all the changes in that data and we make it available to you before you see it in the traditional channels. We’ve been looking in the data to see how fragile this real estate market is in the face of consistently higher mortgage rates and why now it seems like it’s the rapidly changing rates that are the risks.
This week there are 459,000 single family homes on the market across the country. That’s up 1.9% from last week. It’s still 10% fewer homes on the market now at the end of June than over the New Year’s holiday this year. Normally by mid June you’d have 10-20% more homes on the market than over the holidays. But this year we have fewer.
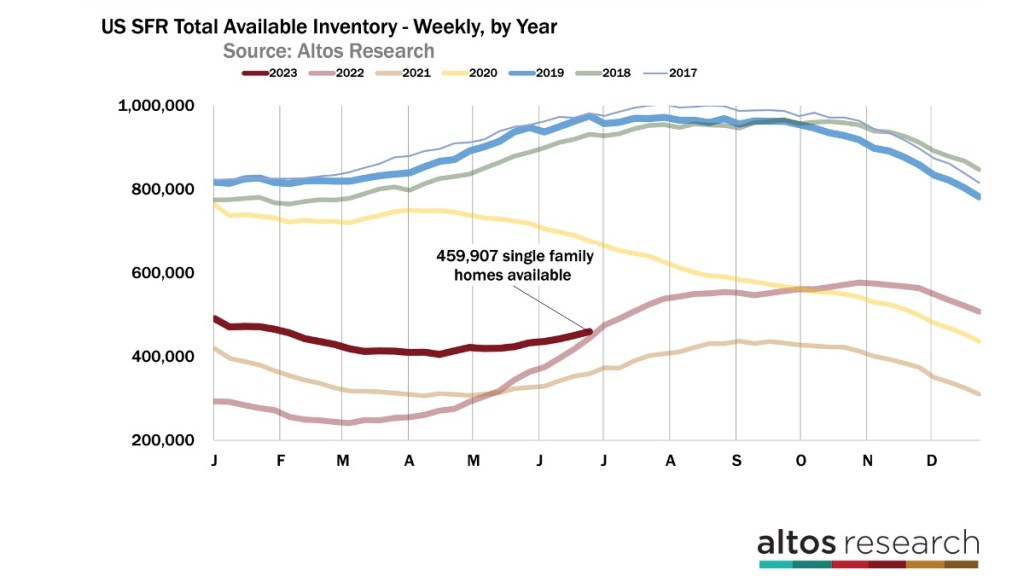
In the chart above, each line is a year, with the curve of available inventory for the year. This year is the dark red line, almost halfway through the year. We started 2023 with 80% more homes on the available market than last year. Next week we will have fewer homes on the market than last year at this time — a dramatic change.
This chart is handy to see where the rest of the year will play out. We have six or eight more weeks of rising inventory, unless mortgage rates spike like they did late last summer.
We’ll finish 2023 with 10% fewer homes on the market than we started the year. In years like this — where demand exceeds supply — this is a good rule of thumb for home price increases another year in the future. That bodes well for home prices in 2024. At these mortgage rates, and these home prices, which are dramatically less affordable than they were 18 months ago, we still have more demand than the restricted low supply.
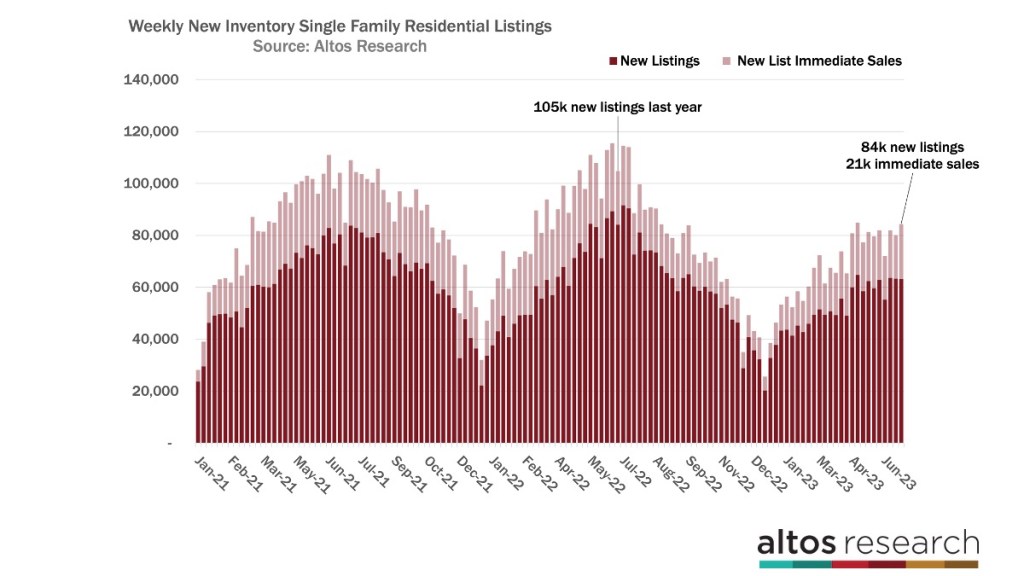
Last year, in June 2022, inventory was climbing by 6% per week as demand had stopped cold and the last of the sellers in 2022 were hoping to squeeze in a sale. Last year, the changing market pulled supply forward into June. In June 2022, each week was seeing 100,000 to 120,000 new single family listings each week. That’s not a lot historically speaking but it was the peak for the year.
This year there is no peak.
There are just very few sellers in a supply-constrained market — only 84,000 new single family listings this week. Of those, we saw 21,000 immediate sales. Each bar in this chart above is the total count of new listings in a week. The taller the bar, the more new supply. You can see how dramatically less supply the market is getting this year, compared to last.
The light part of the bar are those that went into contract immediate after listing. The rate of immediate sales has been falling as mortgage rates jumped from 6.5% to 7% but it seems to have stabilized this week. It makes me wonder if consumers are most sensitive to changes in mortgage rates rather than to the absolute level.
Mortgage rates are higher than they were a year ago, but they’re stable now for a month. Last year rates rose so rapidly, that it froze the market solid. Homes started moving a bit in July and August. Then rates jumped again in September and the market froze again. By January home buyers had adjusted to the new normal and started buying again. It’s something to watch.
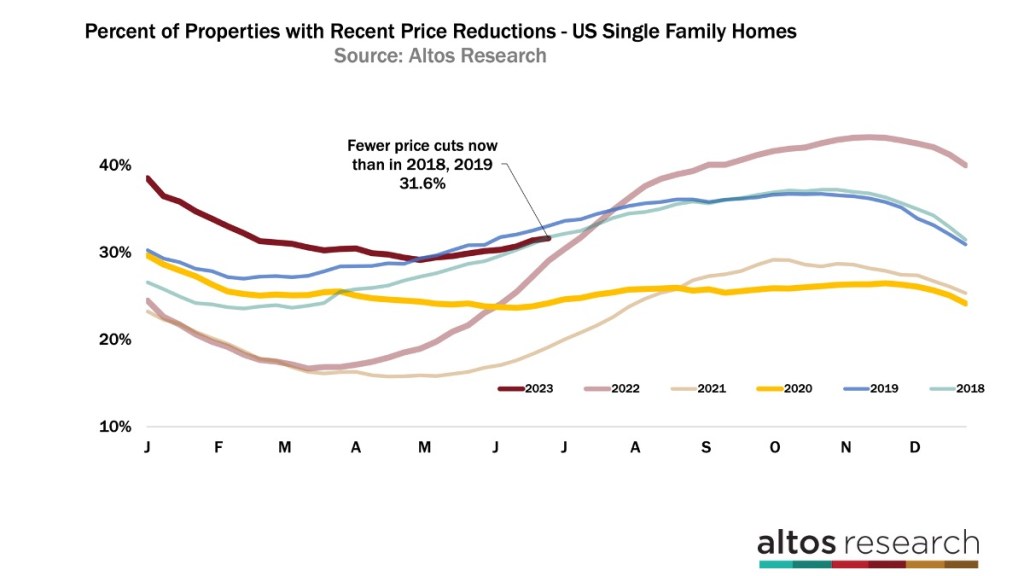
Because we saw a few more transactions this week, we also see that fewer sellers need to do a price reduction. There are now 31.6% of the homes on the market that have taken a price. That’s fewer than 2018 or 2019. It’s in a totally normal range. Last year, price cuts were accelerating dramatically each week. This year since we have more demand than available supply that just isn’t happening.
The market will have fewer price cuts than last year in just three weeks. Last year’s light red line was just skyrocketing at this point. And the slope of the line tells us so much. This data looks at the whole market so the steeper the slope the more new price cuts happen in a given week. Or see the yellow line of 2020 when demand was accelerating during the first summer of the pandemic.
Price cuts show us a much more balanced market now than any of the last three years. And remember that’s balanced at these prices and these rates. There are no signals anywhere in the data that home prices will fall this year. If you’re one of those who assumes affordability challenges means that home prices must fall, there is no sign anywhere that home prices are falling so it’s something to keep in mind.
Median price remains unchanged
The median price of single family homes in the US is unchanged this week at $455,000. That’s a fraction lower than last year at this time. Last year the median price started falling quickly in July. The end of June is often the peak pricing week. In fact we could see a couple more weeks at this plateau. You can see the peak last year was quick. This year might be more stable for a few more weeks before the market changes in the second half of the summer.
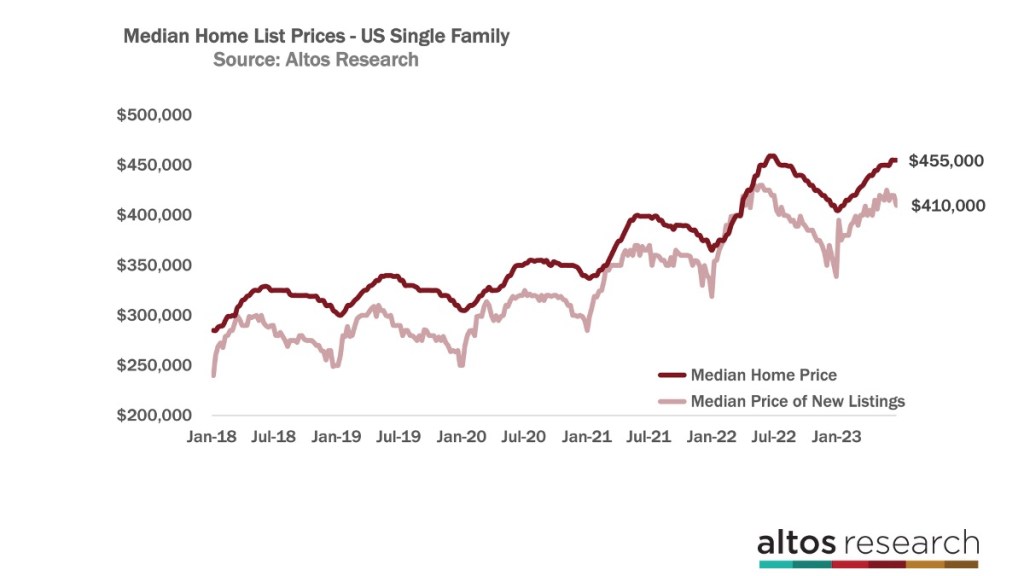
All the pricing signals show us that home prices are not falling. In fact, some are starting to point to the fact that we could end 2023 with positive home price changes. For a year, we’ve been pointing out how home prices for 2023 would be likely flat from 2022.
Sometimes the data looks like that’s optimistic, right now the data looks like flat is too pessimistic because some of the signals are surprisingly positive. I suppose that means we should hold the line and call 2023 flat for home prices.
The light red line here is the price of the new listings. That one bounces around a lot more than the overall market and this week it ticked down 2% to $410,000. The price of the new listings is important to watch because it’ll tell us the signals of demand shifts very quickly. Last July, the price of the new listings fell by 5% in just early July. So keep your eyes here to see the trend for the rest of the year.
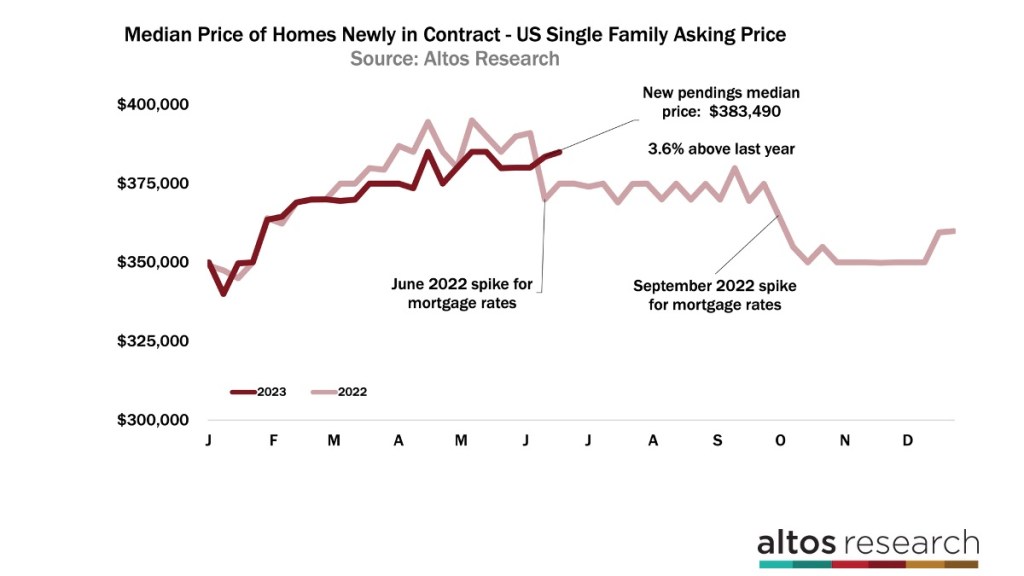
Here’s another view of prices and that might be the most illuminating. The median price of the homes going into contract each week is now $383,490. That’s up a tick from last week and 3.6% higher than last year. The price of the new pendings has been below last year since March. These are the pendings, so they go into contract and the sale closes typically in 30 or 45 days or so.
Notice how this year’s dark red line was lower than last year and is now above last year? Last year’s big home price adjustments happened in July and again in September when rates jumped. This year we’re not looking at those price corrections so the year-over-year comparisons get much easier. This is what I mean when I say that many of the home price signals for the rest of the year are starting to look bullish.
The end of June always a transition point
This year, you’ll see the headlines start to change too. The basic fact remains true, home buyers and sellers need to know what’s happening. They have a lot of opinions and a lot of noise to filter. They need you to get them the actual data as soon as it becomes available.
Mike Simonsen is president of Altos Research.
