Mortgage rates only kept climbing in the last week. Buyers in this real estate market notice these affordability changes, and so we can see in the data fewer home purchase offers, slightly climbing unsold inventory, and slightly more price reductions for the homes that are on the market. This is the same pattern as we talked about last week. The first half of the year had surprisingly resilient sales, but that is slowing again. Mortgage rates are at their highest level in 20 years because the economy just keeps reporting strong data. And every uptick in mortgage rates leads to a downtick in the number of home buyers in the market.
Rising rates make more inventory. So how much inventory will we add this fall? Well as of now, these slowing signals are subtle. This housing market is much different from last year at this time. Last year, rates climbed dramatically and so did inventory. Now rates are inching up, and so is inventory. If mortgage rates jump to say 8%, that’s when we’d see big changes in inventory and home prices. Keep watching these numbers here.
Inventory
Inventory of unsold homes on the market is ticking up. It now doesn’t look like next week will be the peak of inventory for the season. It looks like inventory will keep climbing into September. There are now 495,000 single-family homes unsold active on the market. Inventory rose by just under 1% again this week.
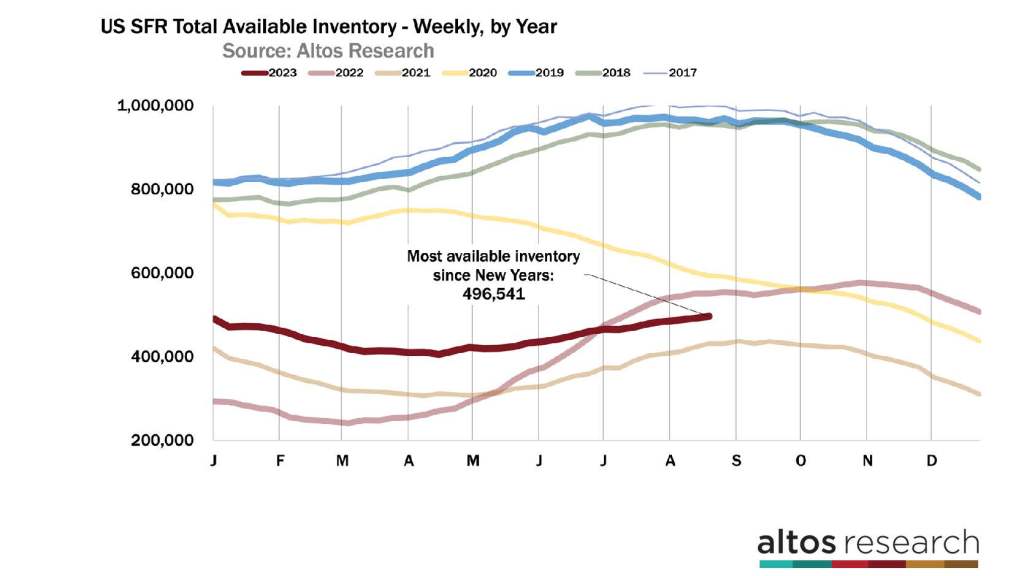
This inventory climb at the end of August is not unusual. It’s not a rapid rise, but it also doesn’t appear to be leveling off. Inventory often peaks the last week of August, the fall has fewer sellers and it keeps shrinking through the holidays. Now because mortgage rates have been notably climbing for the last several weeks, we also expect inventory to keep climbing into September as fewer buyers make offers on the existing inventory.
There are 10% fewer homes on the market now than last year at this time. Last year inventory spiked from March through July with spiking mortgage rates. Then it leveled off a bit. So this week inventory lost ground on last year. The inventory gain week to week was more than it was last year at this time. That’s the first time this happened in many months. Last week there were 10.5% fewer homes on the market, this week that’s only 10% fewer. This is one of the subtle signals that higher mortgage rates have slowed this year’s home buyers again.
To understand the future of housing inventory in this country remember the Altos Rule. The Altos rule says that the more available inventory of homes to buy is the result of higher mortgage rates. If rates climb, so does inventory. If rates fall, inventory will fall.
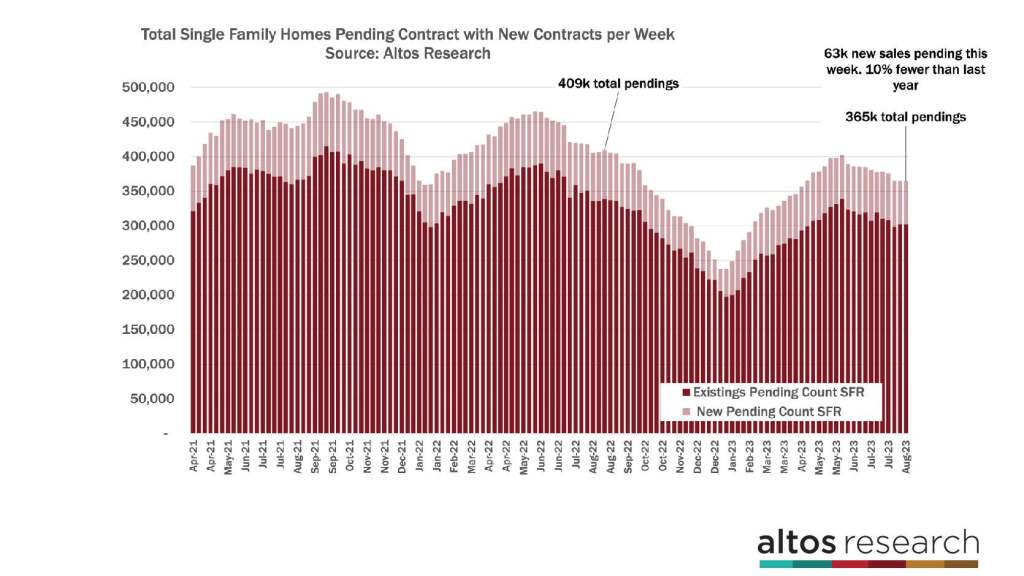
There are 365,000 single-family homes in contract now. That’s up a fraction from last week and 10% fewer than last year at this time. New pending sales of single-family homes going into contract this week came in at 63,000 vs 70,000 last year. In this chart, the height of each bar is the total number of homes in contract that week. The light red portion of the bar represents those newly in contract. The sales rate has slowed since rates did their latest jump of over 7%. In fact, I’d expect the NAR headlines to keep falling on the pending sales measure as well. We could see the sales rate tick down to four million annually on their seasonally adjusted annual rate in the next couple of months.
I’m looking forward to the time when the real-time data starts to grow and the sales rates look more bullish than the headlines, but that’s not happening yet. As we watch the new pending home sales data each week, the next trend we’ll be looking for is how quickly the new pending sales rate shrinks this autumn. See in the chart how the light red portion of each bar shrank so quickly last fall. We had some recovery in the first half of this year. We started the year with 30% fewer homes in contract.
That gap narrowed to just 10% fewer. But we’ve been unable to get closer than that. The market was accelerating this spring, but it is not doing so now. I suppose these negative swings are the other side of the coin for what I’ve called a soft landing in housing. Housing demand cratered, but home prices didn’t crash. Home prices declined in July and September last year, and recovered a bit in the first half of this year. Now demand is softening again and that will keep home prices from appreciating much from here.
American homebuyers are very sensitive to mortgage interest rates. And while higher mortgage rates have hurt affordability for so many, it’s really the change in rates that spur changes in demand. Early this year we had more home buyers than sellers, even with rates in the six-percent range. When rates jump to 7.2% that’s when we see the demand data react accordingly. So it’s not the absolute level, it’s the change in rates that we should be paying attention to.
Price
And we can see it in the home price reduction data too. Price reductions are about to inch above 2018 and 2019 again. 35.5% of the homes on the market have had price reductions. Price cuts always tick up late in the summer, and this year’s seasonal increase is speeding up just a bit with the recent higher mortgage rates. Each week we have slightly fewer buyers, making slightly fewer offers, so slightly more sellers cut their asking prices.
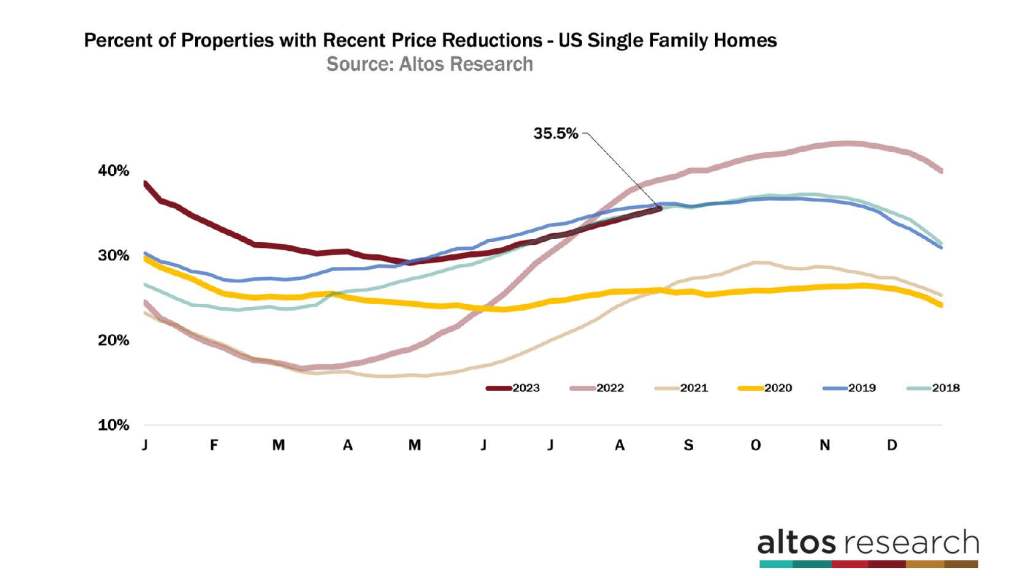
Watching this price reduction curve has been so valuable lately. So insightful. In this chart, each line is a year. You can see last year’s light red line started climbing in March. That told us the pandemic frenzy was over. In September last year, price reductions spiked again with mortgage rates. This year, the dark red curve showed us how rapidly the market was recovering. That told us there was a floor on how far home prices could fall. It really highlights how effective this stat is for understanding the future of home sales prices. Right now 35.5% of the homes on the market have had a price cut.
This is a totally normal level. It is rising, not rising fast, it’s not a strong signal, but it is rising faster than in recent years for August. That tells us that sellers are seeing fewer buyers than they anticipated. This buyer slowdown means any home price appreciation we’ve had year over year is weakening and may be in jeopardy.
Tracking price reductions on the listed homes on the market is really insightful at the local level too. Right now we can see for example that Austin Texas has the most price reductions of any big market and that seems to be climbing. You can use the Altos data to understand local differences which are so important right now.
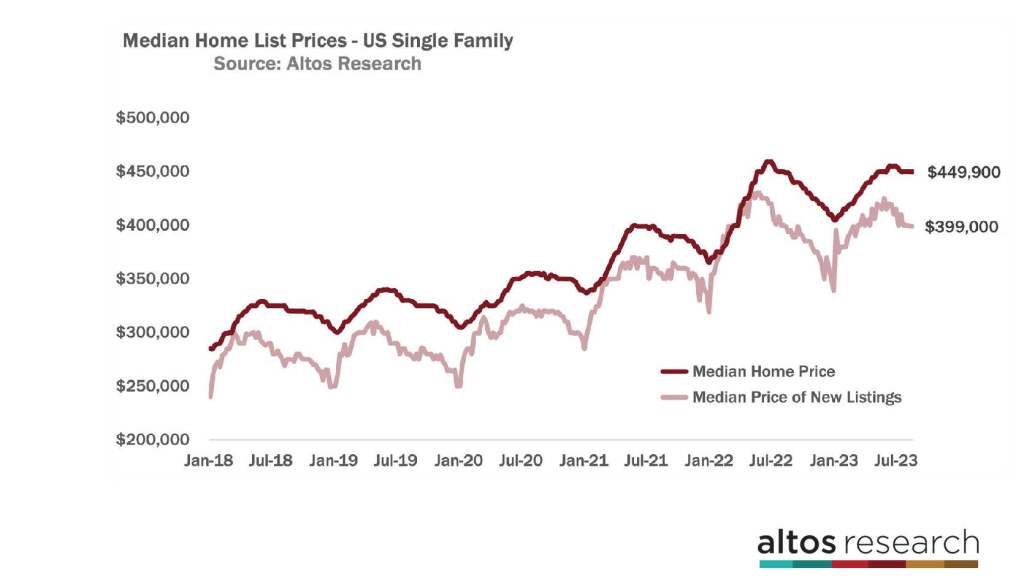
The median price of single-family homes right now across the country is $449,900. That’s basically unchanged from last week and from last year. Prices tend to cluster around the big round numbers, in this case, $450,000, with a big group priced just under that for search purposes. So home prices are at this $450,000 plateau for a while. That’s the dark red line on this chart. See at the far right end the little plateau. Home sales prices in the future are falling because we can see the ask prices are very stable. Much more stable than they were last year at this time.
The median price of the newly listed cohort this week is $399,000 again that’s also unchanged from last week. That’s the light red line on this chart. The price of the newly listed homes is 1.3% higher than last year at this time. This is when homes go on the market, the sellers and the listing agents know where the demand is, where the buyers are and they price accordingly. So the price of the new listings is an excellent leading indicator of where home sales prices will be out in the future.
We’re in this tricky space looking at year over year home price changes now. Last year the market was slowing so quickly that the comparisons now to last year start to look easier. Prices were falling last year with frozen demand. This year the market is slowing gradually. You can expect that the annual home price appreciation would continue to improve even though the momentum is a bit negative right now. It looks like we’ll end 2023 with home prices up a few percent over where 2022 ended.
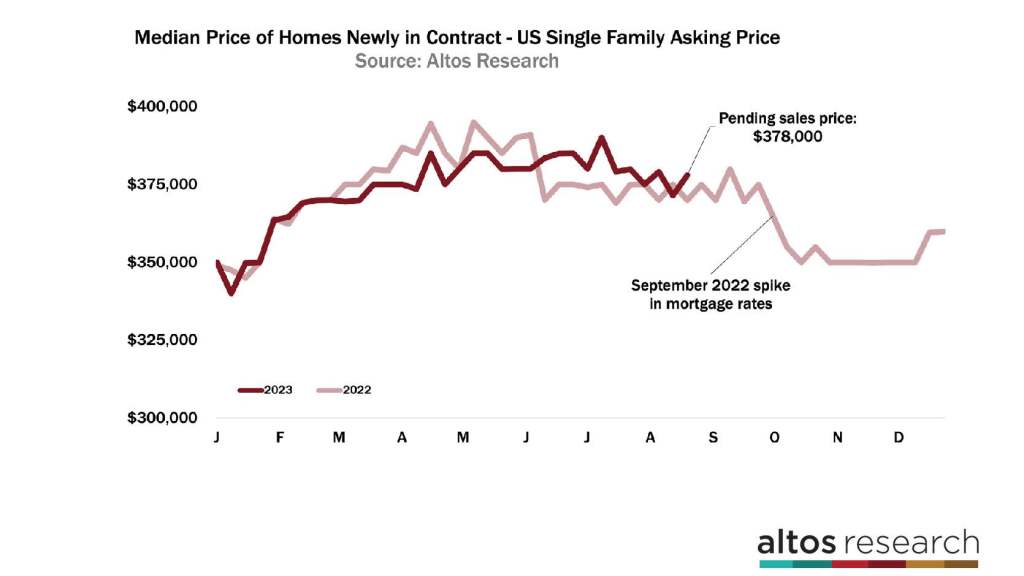
And when we look at the price trends for the homes going into contract, we can see the earliest proxy for the sales which will actually close and get recorded in September and October. You can see that the last several weeks have put a little downward pressure on what home buyers are willing to pay. See how the dark red line was above last year for a few months and then in recent weeks, the dark red line is compressing closer to the light red line. That’s sales prices giving up their annual gains with higher mortgage rates.
The median price of the homes that went into contract this week is $378,000. That’s up a tick from last week and over last year, but you can see in the chart the dark red line is drifting lower. Now, the sales comparison gets a lot easier in September when we had that big rate spike in 2022. So assuming we don’t have another mortgage rate spike, the annual price appreciation will continue to improve. On the other hand, if we see 8% mortgage rates, there’s no reason to believe that home prices can’t gap down again like they did last year.
Again this is a very clear reaction to the latest surge in mortgage rates. We have fewer buyers and those buyers are willing to pay just a little bit less. The opposite is true too. If rates were to drift lower, you can expect more buyers, less inventory, fewer price cuts and higher prices in data measures like this one the price of the newly pending sales each week. The data is very clear right now.
See you soon.
Mike Simonsen is the president of Altos Research.