


I’ve been talking about how this is a supply-constrained market. Now, finally, at the end of April there is a little more inventory. The good news is that there’s more purchase activity too. This seems to confirm my conclusion: more supply of homes for sale means more home sales.
This is notable because if you use mortgage purchase applications as a proxy for housing demand, you’re underestimating demand. Purchase apps are low relative to previous years. Fewer home sales are happening now, but the underlying demand is better. There are too few sellers. The quantity demanded is greater than the quantity supplied. That’s what we see in the data right now.
Inventory
Last year the headline of this video was “Inventory is skyrocketing.” During the last week of April 2022, inventory rose 6% in one week. This trend was coming off the crazy COVID-19 pandemic lows of course, but it was really telling about how abruptly purchase demand stopped.
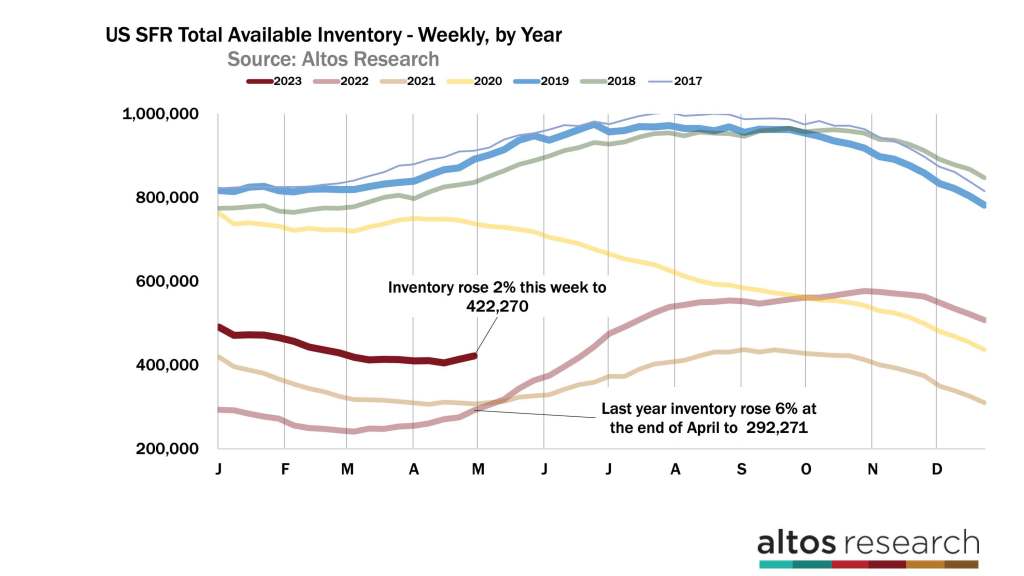
Now, this week in 2023, inventory rose 2%. It’s a healthy clip and very much welcome. In 2022, inventory rose because demand was slamming on the brakes. It’s a much different dynamic now. There are now 422,000 single-family homes on the market across the U.S. In 2022 at this time, there were only 292,000 homes on the market. There are 44% more homes on the market now than there were a year ago. Remember that just two months ago there were 75% more. The inventory difference from 2022 is shrinking dramatically even as we finally get a little supply building for the spring season. In the chart above, the dark red line represents 2023. The light red line is the curve from 2022, and you can see how inventory started piling up around this time. It’s starting to look like 2023 will end with just about the same or slightly less inventory than the amount at the start of the year. So, the inventory gains will be totally gone. Inventory will probably finish the year at 500,000 single-family homes on the market.
There were the most new sellers of the year this week. 85,000 single-family homes were listed for sale, but that compares to 99,000 in 2022. There are 15% fewer sellers now. Of those 85,000 new listings, 20,000 are already in contract. The light-colored portion of each bar represents those immediate sales. These properties get listed, take offers immediately and go into contract in just days. So this chart shows us that supply is inching up and buyers are happy about that. Supply and demand are both lower than they were in 2022 of course.
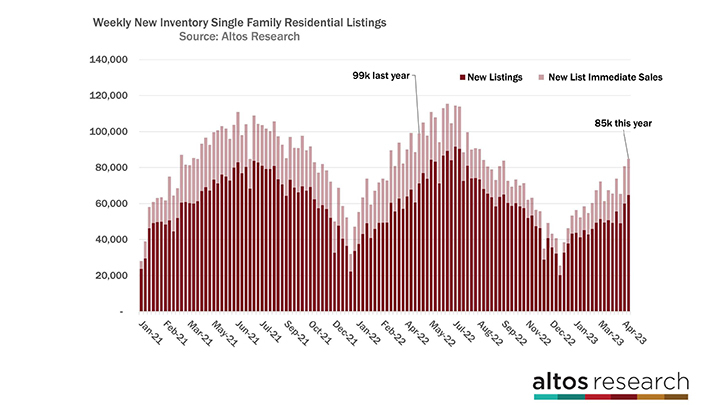
In April of 2022, inventory was already piling up very quickly, and it was not due to a flood of sellers. In 2022, the seller supply stayed in a normal flow — the bars weren’t super tall — but the inventory increased. This year we’re just now starting to get more sellers. Each week the levels are increasing, but there are 15-20% fewer sellers each week compared to 2022.
If you’re looking for future inventory, data last week from Black Knight pointed out that there are record few homeowners who are delinquent on their mortgages. American homeowners are in really strong financial shape. It’ll take dramatic economic change before we get resale home supply from distressed sellers. Dramatic economic change may be coming, but it’s not here yet. Maybe 2024 will see that inventory growth if a recession hits deeps. We’ve been looking for this inventory all year, but it’s looking like 2024 at the earliest before it arrives. If ever.
The pace of sales is ratcheting up right now. So each week I’m asking, do the supply and sales rates grow at the same pace? Do sales climb with supply?
The light red bar here in this chart below represents available inventory which we’ve been talking about inching up finally. The dark red bar represents the number of pending sales at any given time. Which is also stepping up each week. In 2022 at this time, inventory was climbing quickly and the pending sales were climbing slowly. The dark red bars in the middle of the chart were on a much flatter curve in April, May and June. While the light red bars of inventory had big climbs each week. One characteristic of the COVID-19 pandemic craziness was that there were more homes in contract at any time than there were available on the market. Usually, there’d be three times as many active listings compared to pending sales.
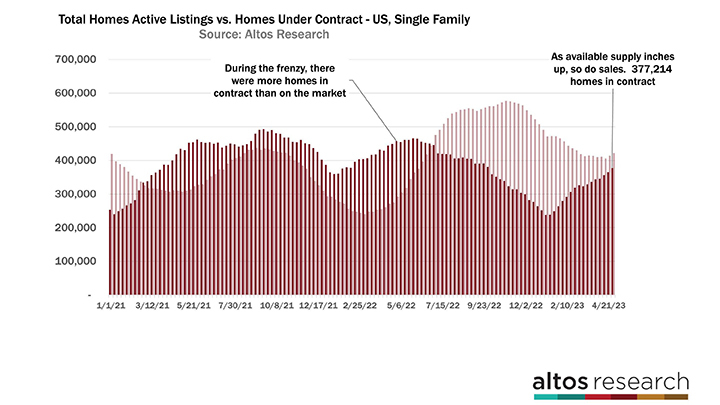
At the right end of the chart, you can see the dark pending sales bar stepping up each week now along with the inventory bar, which has finally started climbing for the spring. So like I’ve been looking for, sales are increasing along with supply.
We can see happy buyers in the price reduction data too. Price reductions are now fewer than 2019 levels and still declining each week. This really illustrates how much different the market is now than it was in 2022 at this time. In 2022, inventory and price cuts were both jumping. As of this week, 29.2% of the homes on the market have had a price cut. There is more fresh inventory this week and some fast sales so fewer and fewer homes need a price cut. This curve will likely hit a bottom in the next few weeks. Then the data will start to increase as homes being listed now that don’t get offers will reduce their price to generate demand. Some of them are overpriced and will need to take a price cut.
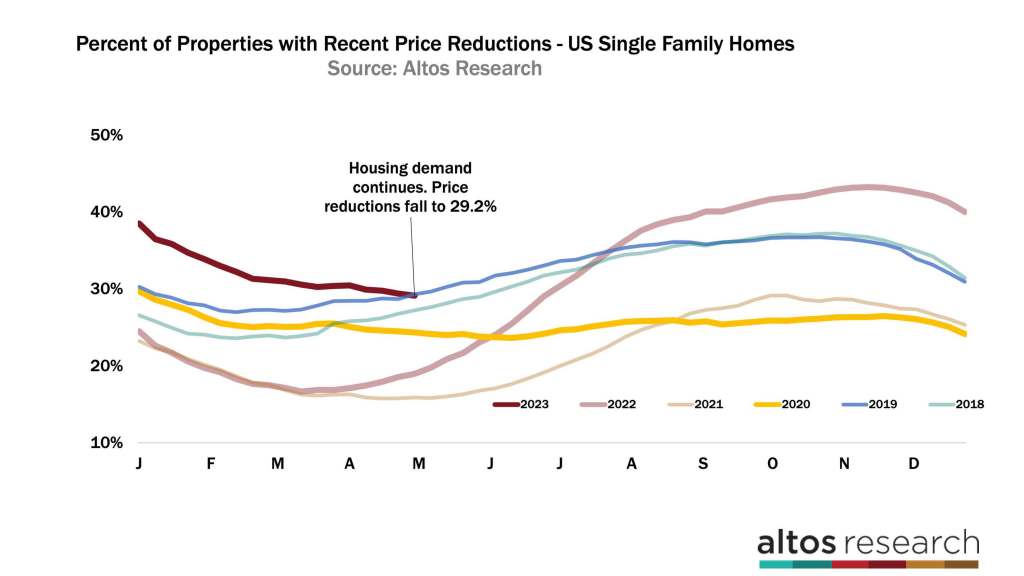
Will we get under 2018 before that happens? In 2018 demand was slowing due to rising mortgage rates at the time. The green line here you can see price cuts accelerating in April, May, June and July that year. Now is the opposite trend. I’ve been talking about the slope of this year’s trend and how it really illustrates how much the market has improved. Keep an eye on price reductions to know when a slowing economy and new job losses start to impact demand. This is a clear signal right here.
Price
The median price of single-family homes in the U.S. is $445,000 this week. That’s basically unchanged from last week and still up a little bit from last year at this time. All indications are that home prices will be flat to slightly down for the year. The demand is out there, but it’s not pushing prices higher. If you pay attention to home price forecasters, you’ll know that the most bearish were saying that home prices would fall 20% from the peaks. That could still happen with a deep recession, but it’s looking almost impossible for it to happen in 2023. Maybe 2024? 2025? We’ll see how hard the economy tanks and which sectors are the most impacted.
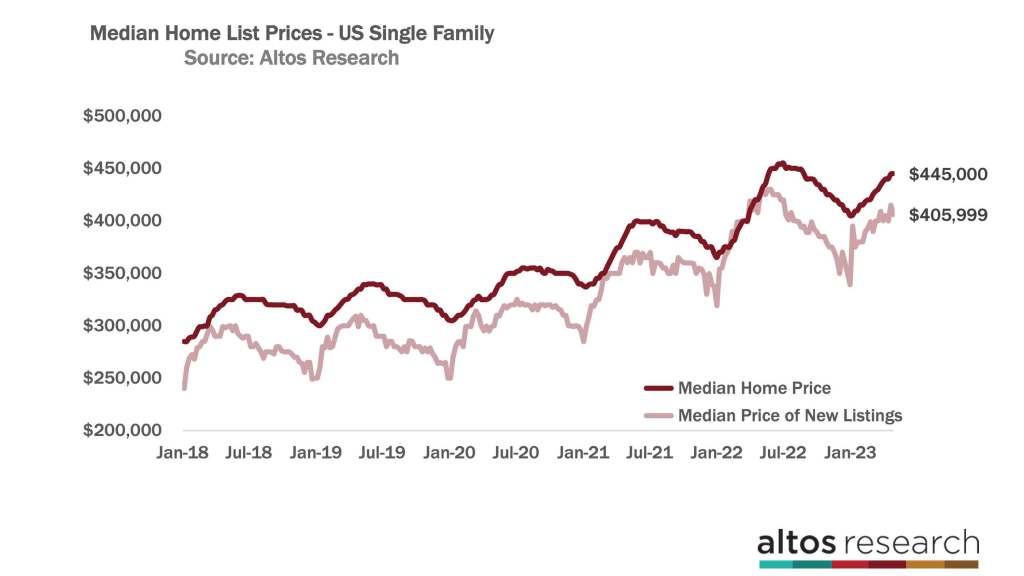
The median price of the newly listed properties this week stepped down to $406,000. The price of new listings are moving sideways over the last few months. That’s a leading indicator of future sales prices and they are not rising. But they’re not falling either. With very few exceptions, buyers are buying at these price levels and these mortgage rates. The median price of the new listings is 4.5% lower than in 2022 at this time. In 2022, it was 6% higher than the year before. That’s a big change from growth to decline.
In the chart below, the dark red line represents the median home price across the U.S., it rises until July 1 each year. This year, it is rising much more slowly than in 2022. According to this data, home prices are flat but not significantly lower for the year.
The light red line represents the new listings, and there is a difference in home buyer demand now from in 2022 at this time. In 2022, the price of the new listings peaked at the end of May, so the year-over-year comparisons will continue to get worse all month.
The median price of the pending sales is now just under $380,000. These are all the homes in contract, so this data is the earliest proxy for the sales that will complete in May and June. And for headlines that you’ll hear in June, July and August. The price of the pending sales is 1.3% lower than last year. This trend is exactly what we’ve been sharing for a few months. Home sales prices are lower than in 2022 at this time.
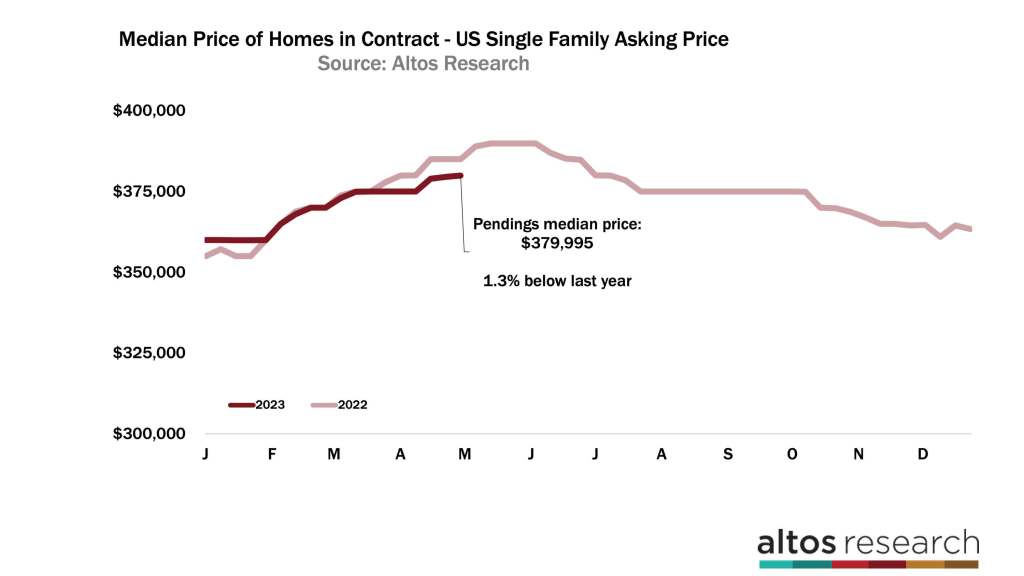
The homes that were pending then were offers that happened in Q1 when the frenzy was just wrapping up. Pending sales prices peaked in May 2022 when that frenzy finally subsided. What this tells us is that the sales that happen in May, June and July this year can’t be dramatically lower priced, prices aren’t falling. It’s becoming very difficult for the country to have significantly falling home prices in 2023. Most of 2023 is already in the bag. Keep a watch here for signals if the end of the year grows weak like it did in 2022. Again, if a recession hits, we’ll pick up the impact quickly.
So many signals in the pricing data. We’ve started to publish the pending sales analytics more in-depth recently. So much to learn there.
More next time.
Mike Simonsen is founder and president of Altos Research.
