


The past few weeks, Altos Research has examined how the real estate market is reacting to mortgage rates near 7%. It seems pretty clear that sales volume has dipped as rates moved up. Home buyers are holding back from making offers. Rates have inched lower in the three weeks since that last spike, but they’re still close to 7%. The HousingWire mortgage tracker lists the 30-year fixed mortgage rate at 6.7% now.
There are measurably fewer sales happening now, compared to when rates were closer to 6% earlier this spring. The sales rate bounced up after the Memorial Day holiday — as it does, but the bounce was not super strong. As a result, we’re no longer gaining ground on the sales pace from 2022 like we had been for the first five months of 2023.
What will be interesting to watch is how this slowdown of today compares with the slowdown of 2022. In July 2022, the housing market really hit the brakes as home sales volumes and prices moved lower. So, even as this market slows with persistently higher mortgage rates, the year-over-year comparisons get easier. We’ll tease out the details today.
Inventory
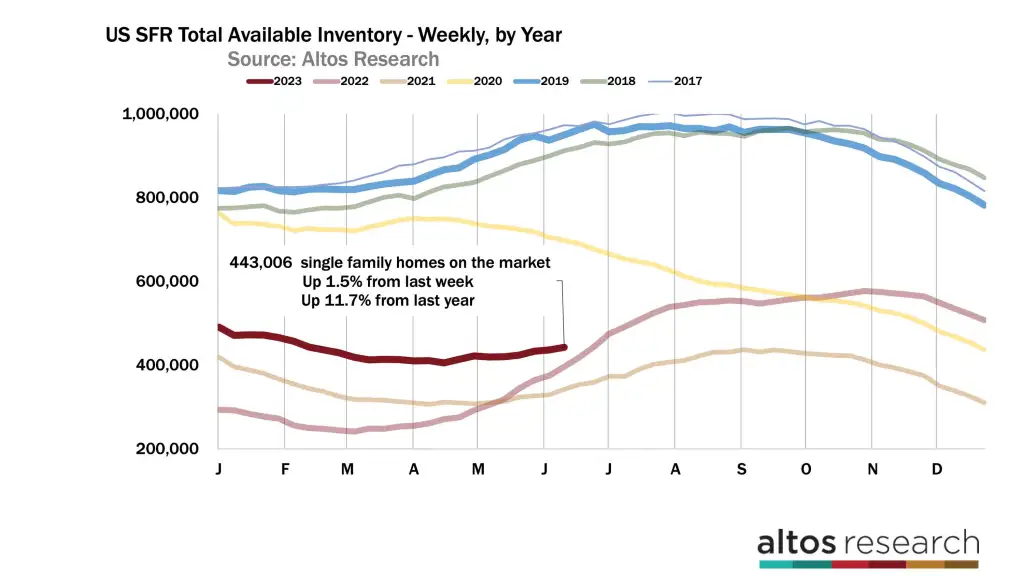
There are now 443,000 single-family homes on the market. That’s up 1.5% from last week and only 11.7% more than a year ago. By July there will be negative year-over-year inventory change. There will be fewer homes on the market than in 2022. I suppose this will hold true as long as mortgage rates don’t spike again over 7%. This trend is very clear, but it is clear that home buyers are very willing to pause when the conditions are not in their favor. In July of 2022, and again in September, home buyers stopped and inventory spiked. The trend of declining inventory due to very few sellers and more buyers has slowed but is still intact. See the dark red line in the chart below. The trajectory will cross the light red line by next month.
Inventory has been critical in this real estate market. But Altos Research has been watching the sales rate very closely in the last few weeks to see the impact of 7% mortgage rates. By mid-June, most years, more sales are completed than are starting, so the total number of homes in contract reaches its seasonal peak. That’s what happened this week.
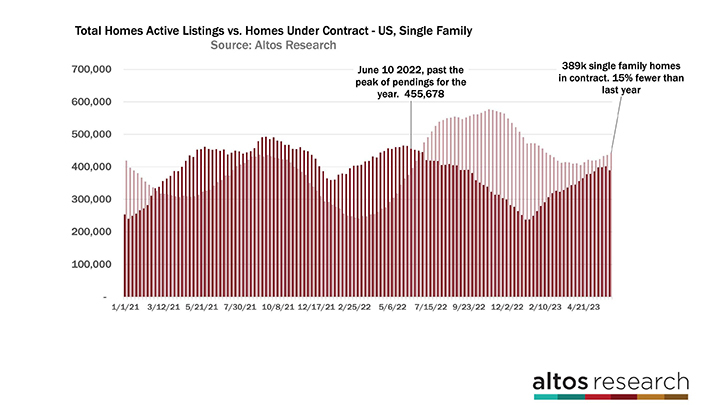
There are now 389,000 single-family homes in the contract pending stage. That’s 3% fewer than last week and 15% fewer than in 2022 at this time. At the far right end of this chart, you can see the dark bar dip this week. That’s the indication that there are fewer offers getting made. The dark bars represent the total count of homes in contract. These are sales that are not yet complete. They’ll close in July and August mostly. The rate of home sales had been catching up with 2022. But that momentum has stalled for the last three weeks with mortgage rates around 7% again. And it’s this sales volume where we see buyer demand slow first. Home prices haven’t adjusted yet, but the data shows that people wait to make their offers to see if rates dip lower again.
It’s interesting now that the data shows this sensitivity in the sales volume rather than home prices. You can imagine that it’d take persistently higher rates, with persistently fewer offers before prices start to adjust. That could happen as early as July like it did last year. If rates stay high or move higher.
Price
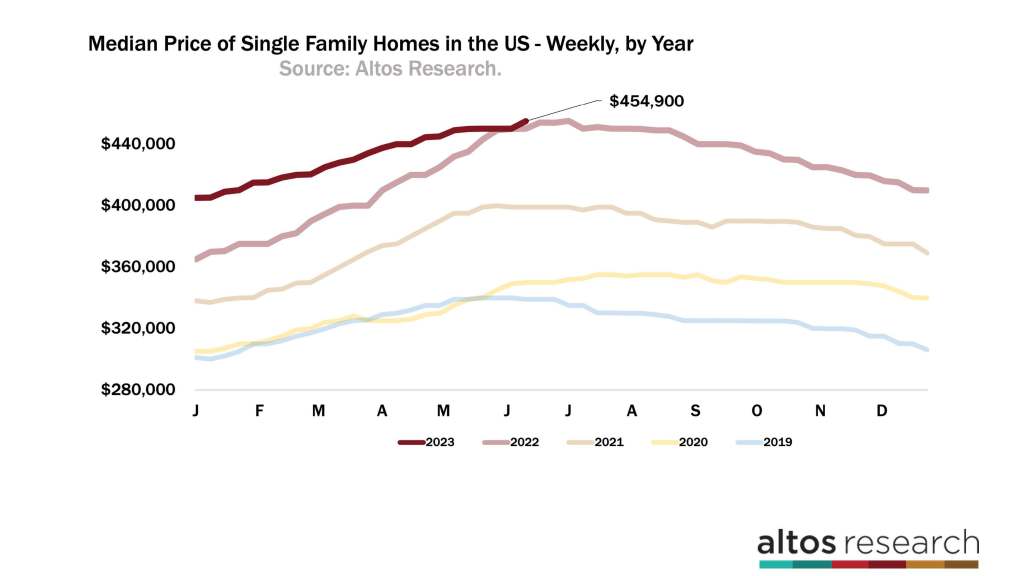
The median price of single-family homes in the U.S. actually increased this week to $454,900. In the view of the chart below, home prices are stacked by year. The comparison with the data from 2022 — the light red line — has been harder each week all year. June is almost always peak pricing. As home prices move down in the second half of the year, you can see why we’ll end 2023 with roughly flat home prices vs. 2022 at this time.
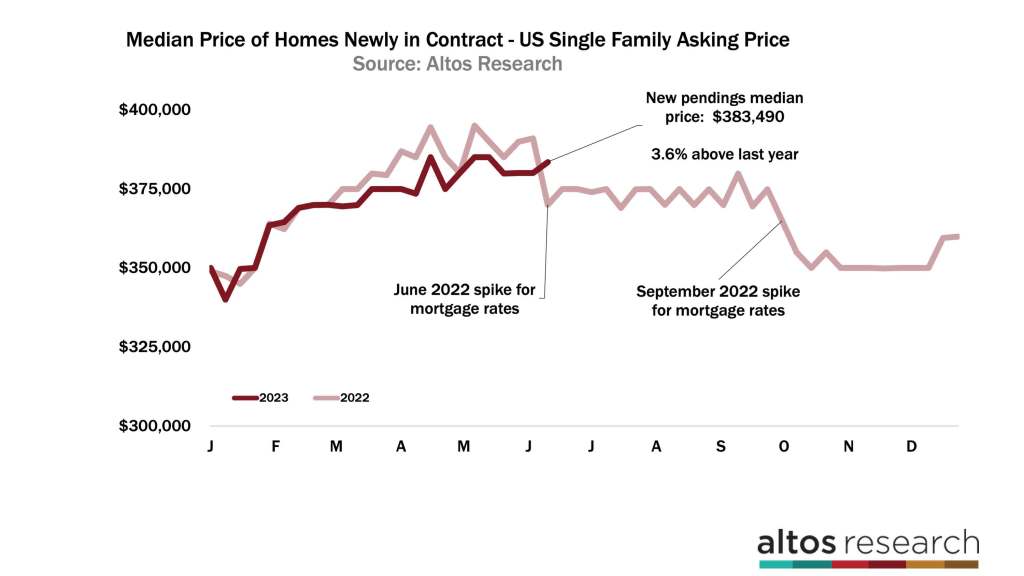
Looking at the price of the homes people are buying, there isn’t really any evidence of prices falling yet due to the higher rates. The price of the newly pending home sales increased this week by 1% to $384,000. I included the chart below for a view of this week because it’s notable that we may now be entering the period where the comparison to 2022 gets much easier. In June 2022, mortgage rates hit the peak from the spring climb and buyers reacted. This is represented in the light red line. The price of the homes people were buying dipped big again in September when mortgage rates spiked to 7.5%. What’s different now is that the data shows the 7% rates are felt first in sales volume, but not yet in sales prices.
The median price of the newly sold cohort is a little volatile, so this isn’t a trend yet. It’s something to keep our eyes on. Most of the other price measures that we track at Altos are staying relatively stable. So our year-over-year sales price comparisons start getting much easier now. If mortgage rates drift back lower, then the transaction volume will pick up again, inventory will fall and there won’t be downward pressure on sales prices.
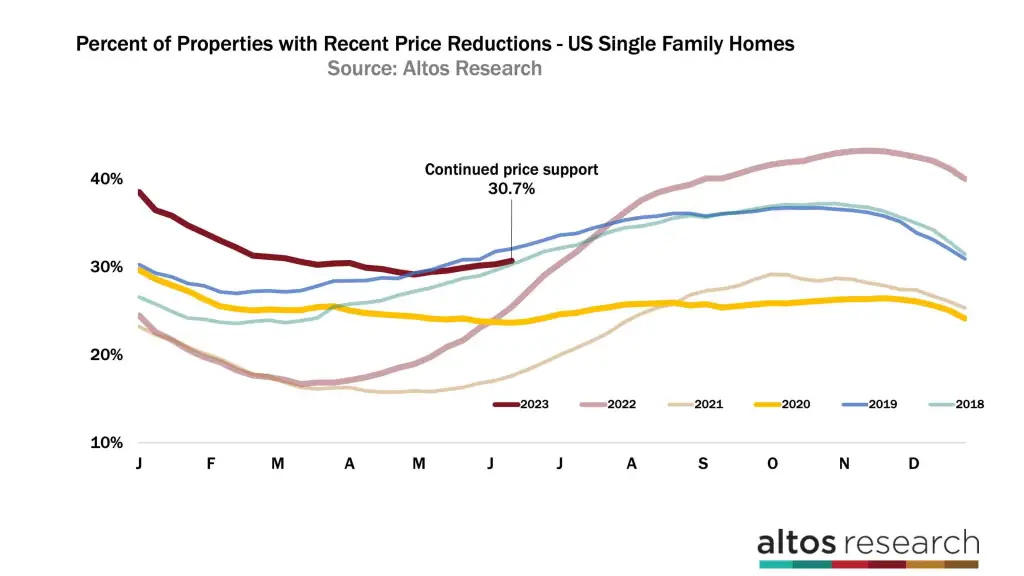
As of today, there haven’t been sellers panicking or cutting prices. Only 30.7% of the market has taken a price cut. That’s up 40 basis points from last week. Which you’d expect for June. In 2022, the home price slowdown was obvious. Price reductions were kicking in by 140-180 basis points per week — now it’s just 30-40 basis points weekly. At the time in 2022, this was how we could easily measure the slowdown. We talked at that time that it meant the home sales which complete in July and August 2022 would have lower prices. This year the price trends are much more supported.
More next week.
Mike Simonsen is the founder and president of Altos Research.
