


It’s no secret that the U.S. real estate market in 2023 has been more resilient than anyone expected at the beginning of the year. It’s also important to note that mortgage rates have surged over 7% recently, and that is sure to slow down any buyer eagerness.
How sensitive are homebuyers to 7% mortgage rates? We can indeed see some signals that buyers do pause.
We know that demand for housing has outpaced supply all year. But mortgage rates really jumped this week with the debt ceiling fiasco in Congress. We continued strong economic news. There are signals that some buyers put their actions on hold. The rate of newly pending contracts fell by 5% this week. The purchase volume has been getting closer to last year’s pace but that trend stopped this week.
If rates stay over 7%, do the little green shoots of market strength quickly wither away? They sure did last September when rates jumped over 7%.
Is this the week the surprise little boomlet of 2023 real estate goes bust again? That’s what we’re looking for in the data now.
Every week, Altos Research tracks every home for sale in the country. We analyze all the pricing, supply and demand, and all the changes in that data and we make it available to you before you see it in the traditional channels. That’s why if this debt ceiling crisis hits us hard, we’ll see it in the data quickly.
Last week’s data
There are 398,000 single family homes in contract. These are the pendings for sales that will complete in June and July. That number is unchanged from last week. Inventory has climbed a bit, and the pending sales rate has been growing right along with it. This week, the pending sales did not grow with the latest inventory. This could be a signal that some buyers froze as rates jumped to 7%.
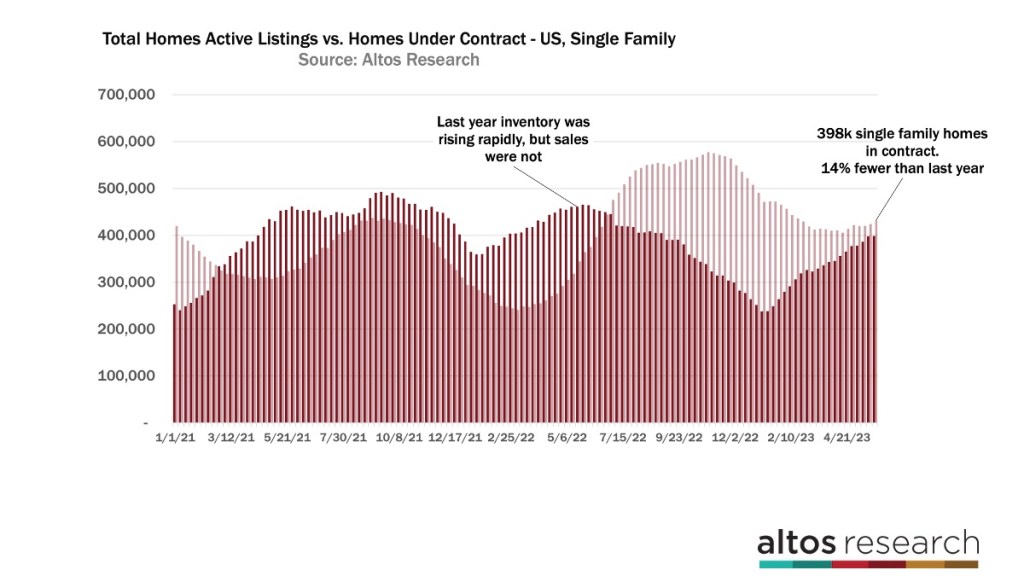
There are 14% fewer homes in contract now than last year at this time. In December and January, there were 35% fewer homes in contract than a year prior. So, the sales rate gap from last year has been narrowing. You can see the dark red bars in this chart, that’s the count of pending sales in any given week. See at the right end of the chart pending sales have been climbing pretty steadily. This week took a pause. The light red bars are the total count of unsold inventory of single family homes.
The most striking thing on this chart is how dramatically inventory was rising last year at this time while sales were not increasing. This year the sales rate climbed before inventory. This is how we know it’s a supply constrained market. Buyers are buying anything that’s available — except maybe this week. The total number of homes in contract plateaued while inventory rose 2%. It’s one week — that’s not a trend. And since over the weekend it seems like a debt ceiling deal was reached, we can expect the markets to move starting Tuesday. So if mortgage rates dip back down, maybe those buyers who paused last week are ready to close a deal this week.
Specifically we can see that new pendings — that is, the count of homes that went into contract this week — are down almost 5% from a week prior. That is also 14% fewer than the same time a year earlier. So we didn’t gain any ground on the sales rate gap from 2022. We’ve been consistently gaining ground but that halted with the rate spike.
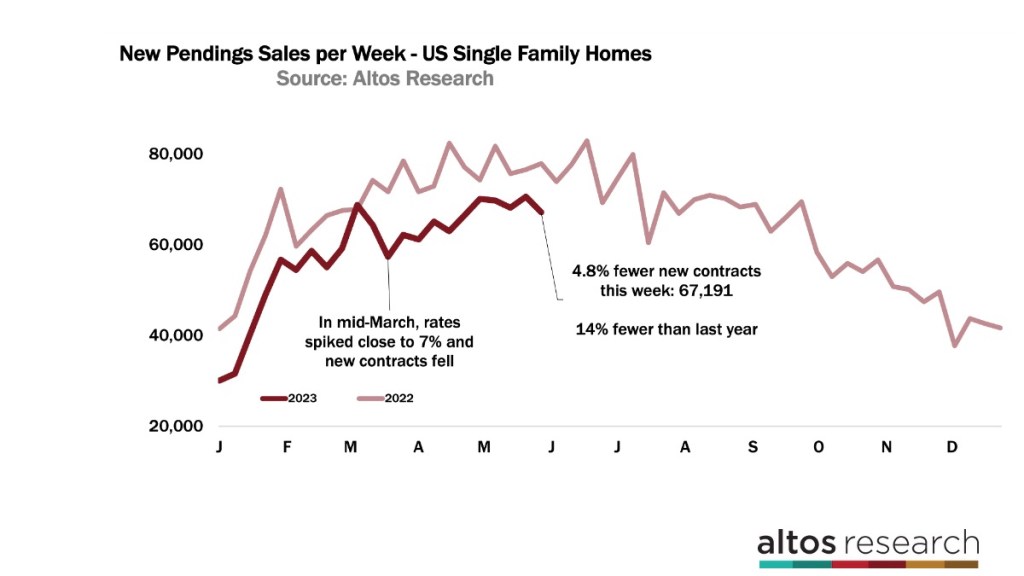
June should see the peak time for home sales and it’ll be fascinating to see the third quarter if we gain ground. Last year’s second half of the year was so frozen. See the above chart — the light-colored line is last year, with the count of new pending transactions each week. The sales rate fell dramatically after July 4.
This coming week’s data will include the holiday, so it won’t bounce. It’s really two weeks from now that we’ll see if there’s a pattern. The pattern I’m watching for is the rate of sales: is it catching up to last year? Could we, by later in the summer, be doing more sales than last year? That’d be surprising, but that’s what I’m watching for.
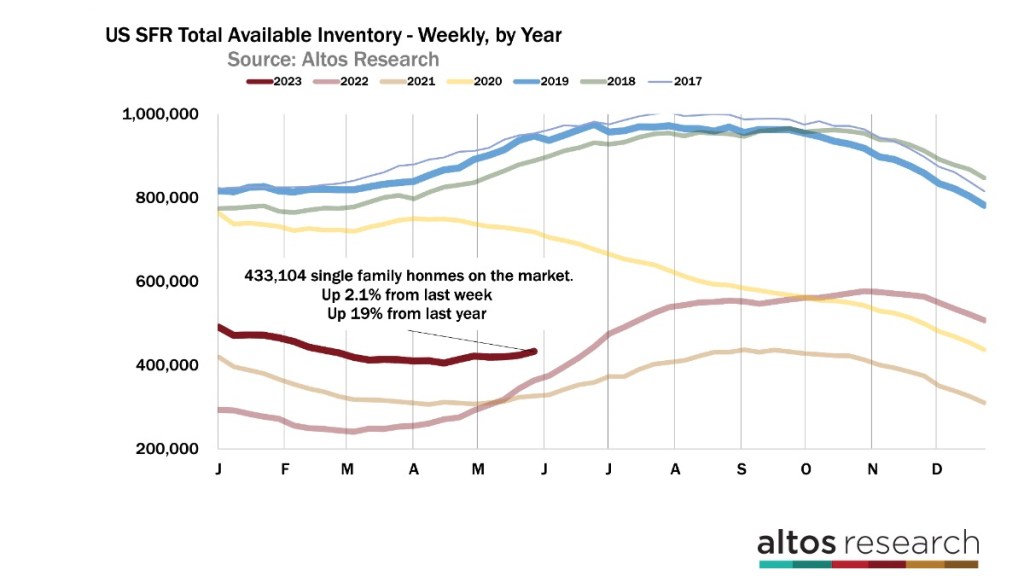
Those are the pending sales which we’re tracking very closely at Altos these days. And I’ve been saying that I see this as a supply constrained market, meaning that if there were more available inventory, we’d have more home sales. This week we saw a little more inventory. It’s the end of May, and you’d hope we’re getting some homes to buy. Available inventory of unsold single family homes rose by 2.1% this week to 434,000. This is good. The increase in inventory was still slightly less than our annual forecast model had expected based on recent years’ behavior in mid-May. But it’s ticking up.
There are now just 19% more homes on the market than last year at this time. In February there were 70% more homes on the market than a year prior. This is just a dramatically different housing market than we started 2023 with. Unless mortgage rates stay over 7% and buyers shut down for a prolonged time, I expect in the next few months we’ll have year-over-year inventory declines. The gap of inventory is shrinking really quickly — even in a week when sales didn’t rise.
We’ve been talking about how year-over-year inventory is up, but the gap is closing. And year over year the rate of sales is down, but the gap is closing. This is also true of home prices.
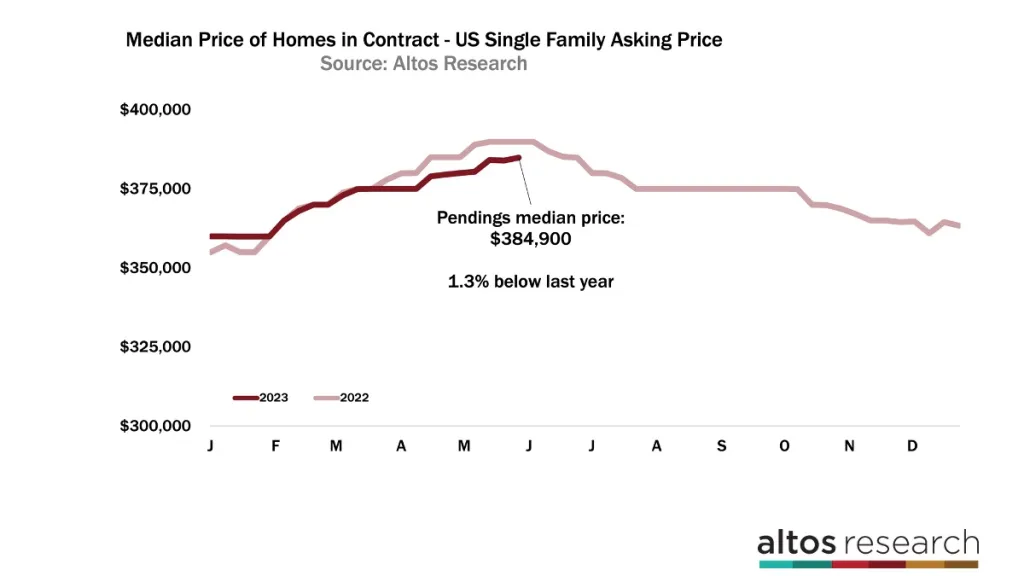
Last year the price of the pendings plateaued in May. This year they’re still inching upwards. The price is below last year by a fraction, but it climbed this week. The median price of the homes in contract is $384,900. That’s up a fraction from last week, and a little closer to the sales prices from a year prior — just 1.3% below last year’s prices. Home prices last June and July started ratcheting down pretty quickly each week. Some of that was seasonal decline but it was more than seasonal. Demand had stopped.
This year it’s going to be really fascinating to watch if sales prices tick up in June. We could enter July with year-over-year home price gains. It’s peak time for pricing, so seasonality could kick in and we might not get prices over last year’s. For the next 4 or 5 weeks it’ll be really fun to watch this number, the median price of the single family homes in contract. Remember that these are in contract which means the sales will close in June and July and we’ll start hearing about it in August. And until at least August we’ll hear the headlines talking about how home prices are down from 2022. Definitely a few more months of those negative headlines. Even as the underlying data is changing.
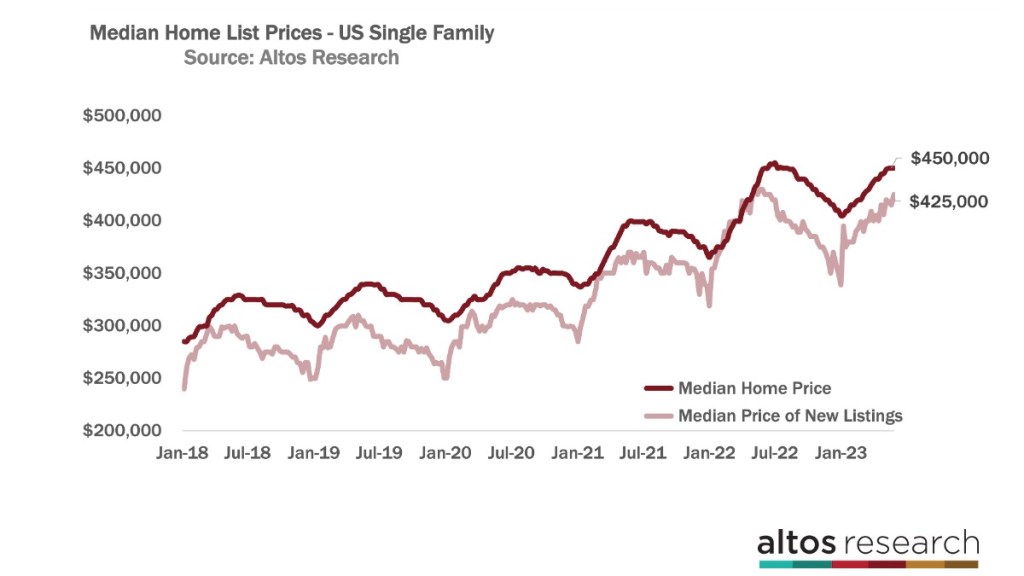
When we look at the price of the homes across the country, the median price of single family homes this week is $450,000. That’s unchanged from last week. It’s also the same as last year at this time. Home prices started moving down very quickly in July last year. Again, some of that was seasonal, but the price declines were really more than seasonal. Will this late summer season hold prices a little more firm? Those are the signals I’m looking for. And if rates stay over 7% do those recent trends reverse?
Since the new listings are the leading indicator, the price of the new listings cohort very often peaks at the last week of May — right now. This year the median price of the new listings is $425,000. That’s 1.2% below last year. Two of the three price measures we track to understand where sales prices will be in the future are still negative year over year. The gap is closing, and I’m watching to see if 7% rates persist and the gap maybe widens again.
Speaking of seasonality, in a lot of years, price reductions are accelerating much faster by now. Usually inventory builds in March, April and May, and anything that’s still on the market starts taking a price cut. This year because so few homes are on the market and the sales rates have been increasing, fewer sellers have had to cut their prices. If mortgage rates stay elevated over 7% and the pause we saw this week sticks around, we should see price cuts accelerate like we did last September. If rates drift back lower, then maybe not.
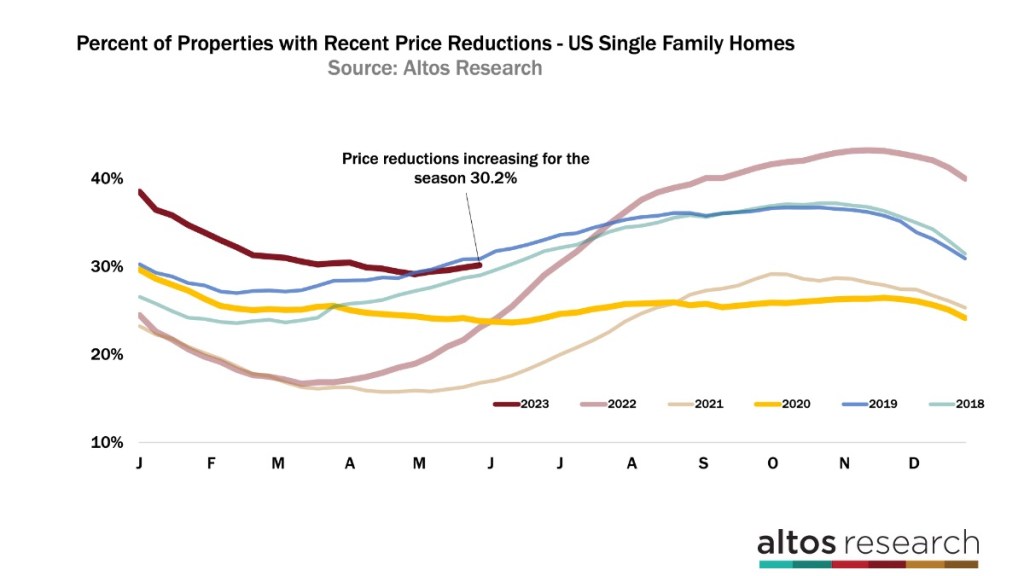
There are now 30.2% of the single family homes on the market that have taken a price cut. That’s a little uptick from last week, 30 basis points. Many years price cuts would be increasing by 60-70-80 basis points per week. That’s why if you look at the dark red line here you can see that this market has fewer price cuts than 2019 and in July will likely have fewer cuts than in 2018 too. In 2018 the market was slowing. This year the market has been accelerating.
Now again this moment might be an inflection point when the trends of the first half of the year change abruptly.
Never a dull moment in the real estate market. The basic fact remains true: homebuyers and sellers need to know what’s happening.
Mike Simonsen is president of Altos Research.
