This week, all eyes are on the economy and recent financial turmoil to know where the housing market is headed for the rest of 2023. The bank troubles seem to be not contained and that impacts consumer confidence to buy homes. At Altos Research we’re not forecasters of the economy, we measure the housing market data. So, I don’t have a view of how broad the impact of bank failures might be, but it sure looks like it has the potential to be very disruptive.
Until now, housing demand in 2023 has been surprisingly robust. Home prices fell across the country late last year, so they are down year over year. However, prices haven’t shown continued declines since the new year. The headlines should start highlighting home price decreases very soon, but these changes are behind the Altos data. Current data shows that prices aren’t yet declining further. But big scary recessions, job losses or things like bank failures could slow buyers abruptly. There are some signs that we’re seeing that already. I’ll show you those today.
Inventory
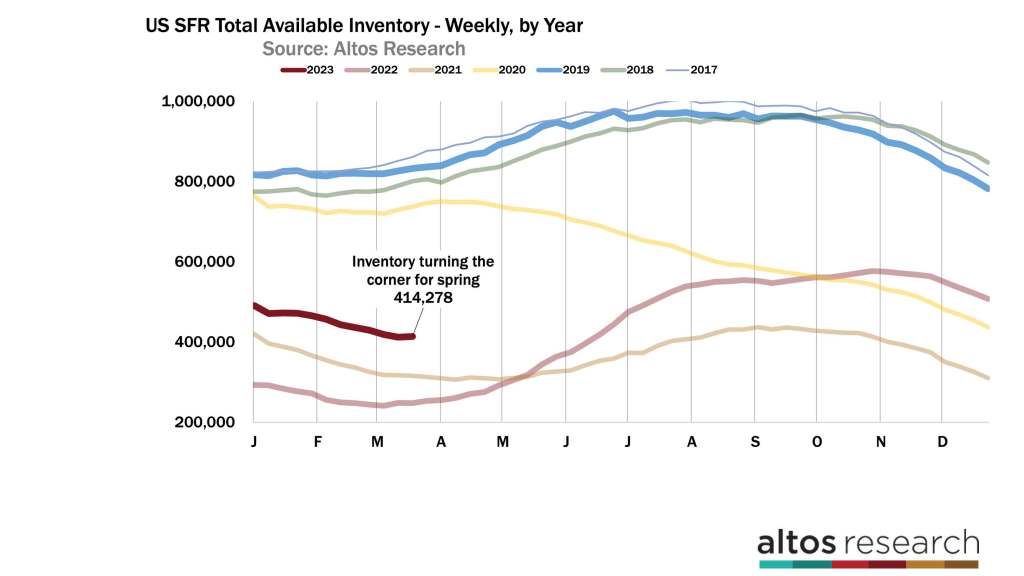
Inventory looks to be finally bottoming out and turning the corner to increasing the selection for the spring. There are 414,000 single-family homes on the market this week. That’s up a tiny fraction from last week. There is finally an increase in inventory for the spring market. I’ve included it as the yearly view of inventory trends this week. Each line in the graph below is a year. You can see how inventory starts the year low, then climbs to peak later in the summer. The dark red line represents 2023. There are 67% more homes on the market now than in 2022 at this time. In 2022, inventory started climbing very quickly in the second quarter after the record hot start of 2022. It was really in May, June and July that inventory started climbing so quickly.
So far in 2023, we’ve been surprised at how robust the market has been. The data has shown very few new listings each week and an increase in buyers, so inventory has been declining. I think we’re about to learn how abruptly this market can change. In February, mortgage rates were around 6% and people were buying more homes than we expected. In recent weeks, the rates jumped over 7% and that’s definitely slowed things down.
Rates declined last week in response to the bank failures. While lower rates are obviously better for home buyers, it’s hard to imagine how bank failures won’t add to the fears that make buyers more reluctant. It looks to me like the signals are showing that buyers will be slowing back down after that surprising first 10 weeks of the year.
This year-over-year inventory chart is useful to show whether we can get back to pre-COVID-19-pandemic levels of inventory any time soon. My guess is that as buyers slow, sellers in this market will also slow. There are 67% more homes on the market now than there were in 2022. The light red line represents 2022. By later this summer that increase looks to be much tighter. Unless of course we have big economic turmoil coming at us. As I said our models don’t predict the economy, though it seems like a real enough risk. More bank failures? More job losses? These risks are real. And like in 2022, we’ll be able to see the effects of the risks in how quickly the supply chart changes.
Price
The median single-family home price in the U.S. is $429,900. That’s up a fraction from last week as is normal for this time of year. Weekly price changes though are significantly slower than in 2022. The next few months of media headlines will be reporting home price declines from last year. The dark red line slope at the right end of the chart below is aiming lower than last year’s peak.
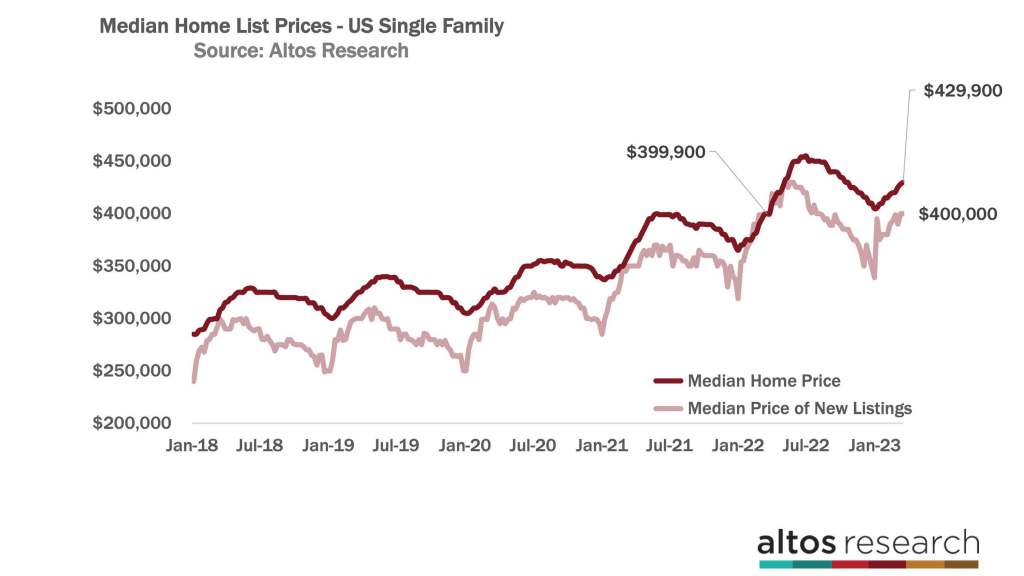
The median price of the new listings is $400,000. That’s already flat from last year. Meaning, the homes being listed now are at the same price as they were in 2022. There’s obviously not enough demand in the market to push prices higher from here. The light red line in the chart below is moving sideways, normally the price of the new listings increases each week in Q1. This data shows us why the headlines in the coming weeks are going to start showing year-over-year price declines. Houses get listed now at the price that the sellers and listing agents think they can get from buyers. These are sales to happen in the future.
Pending sales numbers are just barely inching up each week. The pending sales are the fastest proxy for sales. These are the homes going into contract — where they spend a month or two before the sale closes. There are 329,000 single-family homes in contract now. That’s 21% fewer than in 2022. There was a dip in the newly pending homes this week with only 47,000 single-family homes going into contract. That’s 33% fewer than in 2022 at this time.
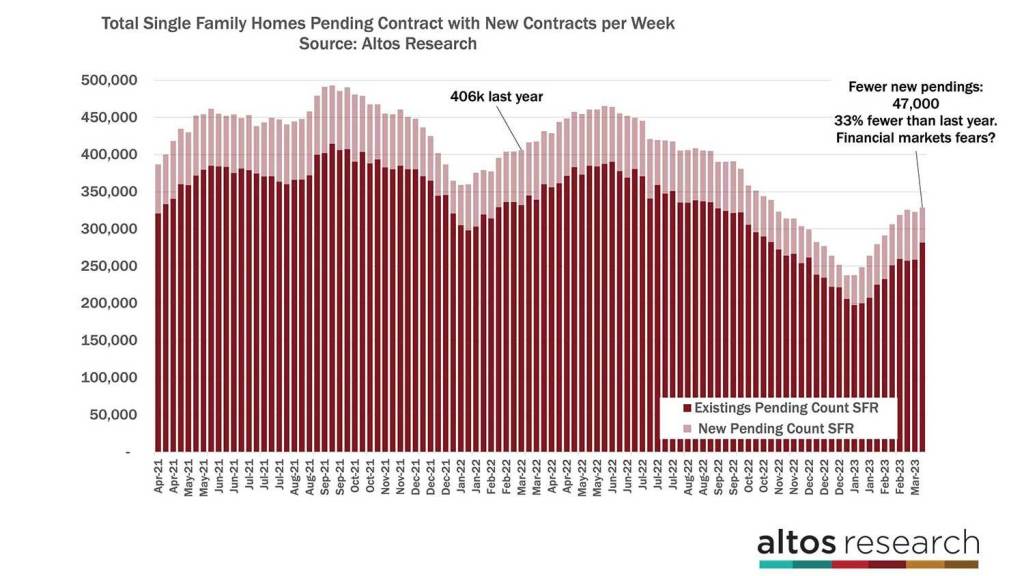
Is that a one-week anomaly? Or, an early signal of consumers fearing financial market turmoil and mortgage rates close to 7%? It’s one week, so don’t read too much into it yet. It’s definitely something to keep an eye on. In the chart above, each bar represents the total pending sales in that week. At the right end of the chart, it’s up 2% over last week, but the light portion of the bar — the new pending sales — is much smaller this week. Again, it makes sense to keep your eyes on how fast homes are going into contract. The economy has been remarkably strong but there are cracks showing. If a recession hits hard, home buyers will definitely slow. We’ll see that data in this pending sales trend chart very quickly.
The price of the pending sales is going to be really interesting to watch over the next few weeks. When we track the pending sale properties, we can watch the price range that people are buying one to two months before the sales actually complete. This week the median price of the homes pending sale is $375,000. That number is unchanged from 2022. You can see how the dark red line in the chart below has tracked along the 2022 curve — the light red line. In the next few weeks, the price of those homes in contract will likely be notably lower than the 2022 prices. This chart doesn’t capture the bidding wars from 2022 when the transaction price was commonly higher than the final list price.
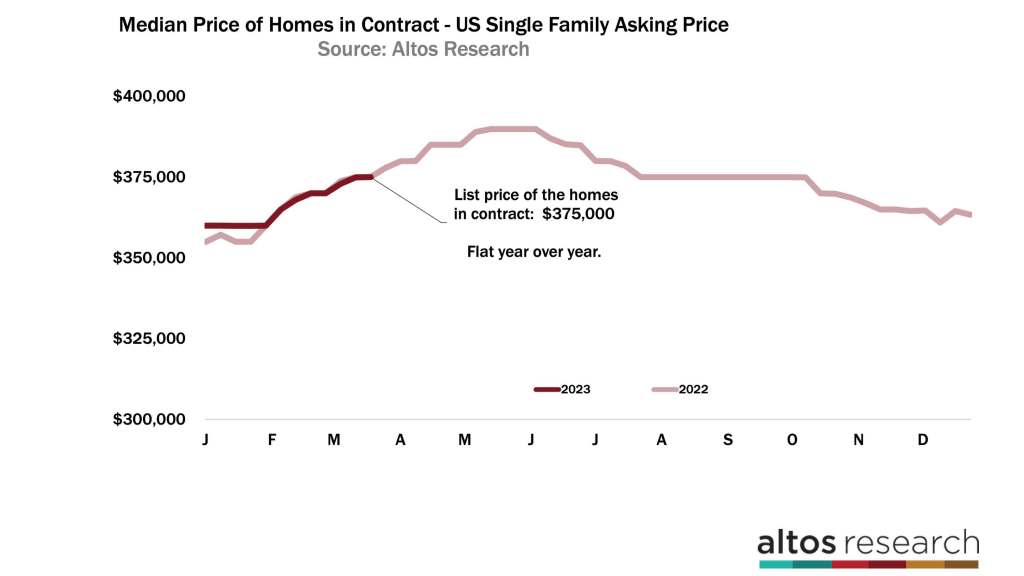
Most of the time, the ratio of the final asking price to the closed sale price is very consistent around the country. Any given home may be over or under priced but in aggregate they’re very close. But in 2022, due to the bidding wars, the final sales price was generally higher than the final list. That data tells us that the homes in contract now across the U.S. are sales priced lower than those last year. I’m guessing that next week the dark red line for 2023 will move under the light red line from 2022. My assumption is that we’ll reliably see year-over-year price declines across the country for the next few months.
So what does that mean? Does that mean home prices are falling? Not necessarily. Home prices can be climbing each week and still be lower than 2022 prices. Remember that most of the price declines happened late in 2022. As of right now, there doesn’t seem to be further downward pressure on prices. But, the annual comparisons are going to keep getting worse for a few months because prices from 2022 were jumping so quickly. If economic conditions worsen, prices could start falling again like they did in the second half of 2022.
For the most extreme predictions of home price declines to be realized — folks who expect 20% plus home price declines — we’d have to have significant economic weakness hit us. It certainly seems possible, but the data right now does not show it yet.
On this chart, first the dark red line would drop below the light red line each week — the median price of the homes pending contract now lower than in 2022 — then it would tick down more quickly in the second half of the year. If those dire scenarios start playing out, that’s what we’ll look out for in the pending sales.
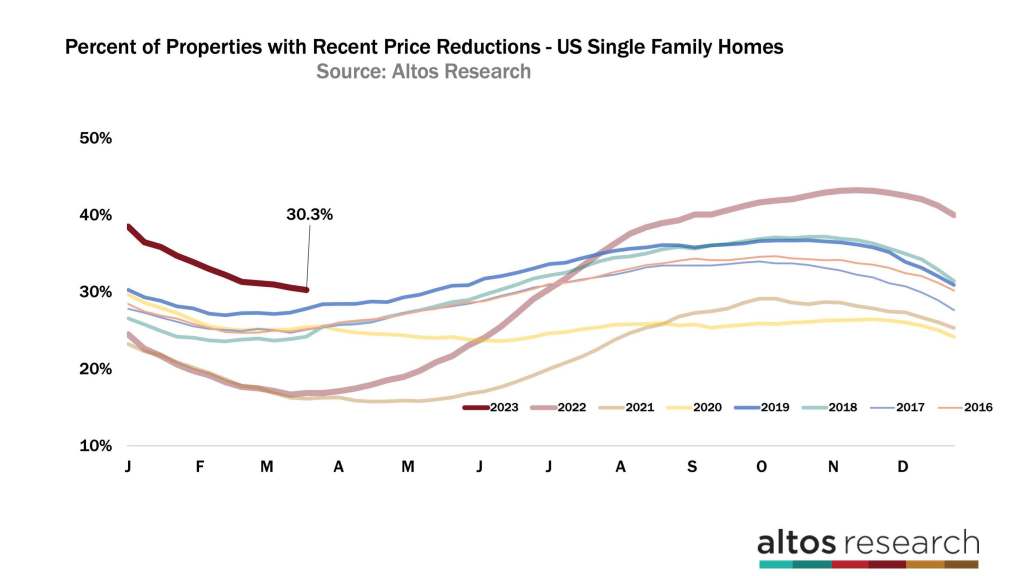
I expect price reductions to start ticking up next week. Once April is almost upon us, the homes listed in Q1 that didn’t get offers yet will start taking price cuts. Price reductions have probably hit their low point here at just over 30%. The question is, do they rise on the curve from last year? The light red line in the chart below really showed us how abruptly demand slowed in the second and third quarters. Again if recession and job losses hit hard, you can expect to see it in the price reduction data. If we manage a soft economic landing, this curve stays flatter. A flatter curve here is an indication that home prices are not declining further.
When the February sales data hits the headlines here at the end of March, remember that the homes that sold in February were on the market and taking price cuts in November and December. We’d expect that for home sales prices to decline from here, there would need to be much weaker demand right now. If the economy drives weaker demand, we’ll see price cuts ticking up more rapidly each week.
It’s the economy and financial markets that we need to keep our eyes on. If you need to know what’s happening in your local market as it happens, go to AltosResearch.com and book a free consult with our team. We’ll help you interpret this crazy market for your clients right now. This is a critical time to be properly informed about the market.
More next week