This week, new pending home sales prices reached a new high for the year. Now, prices are just fractionally lower than in 2022 at this time. This trend is a remarkable development given how dramatically home buyer demand slowed last year, even though mortgage payments are so much higher than they were just 18 months ago.
Could a home price crash still be on its way? Of course, it could. In September of 2022, mortgage rates spiked up to 7.5% and housing demand stopped cold. Inventory rose and prices corrected down. That could happen again, and it’s why we watch the data so closely each week.
Inventory
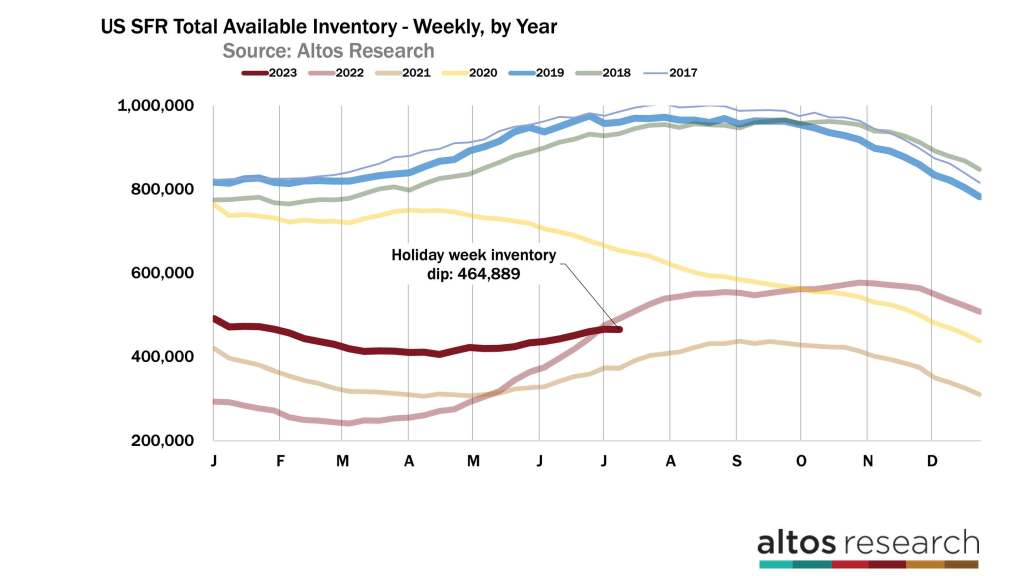
There are now 465,000 single-family homes on the market across the U.S. That’s down a fraction due to the Independence Day holiday last week. It’s quite common in most years for inventory to dip a little over the holiday with fewer sellers listing that week. 2022 was the exception. Last year inventory kept rising by almost 4% over the holiday week. Compare on this chart the dark red line for this year’s inventory curve with the light red line from 2022 on the chart below.
Mortgage rates are persistently above 7% now and the economy continues to demonstrate how strong it is and how strong employment is. So, rates haven’t slid back down like many analysts predicted they would earlier in the year. We have inflation reports this week, and if inflation continues to cool maybe we get lucky on mortgage rates too.
But, as of now, I expect higher rates to slow demand this month. So after the holiday transition completes, expect the market to resume inventory building. If you’re a buyer who started looking last month, suddenly your payments may look worse and you may be more likely to hold off making an offer to wait and see if rates drop again. Fewer offers mean inventory will rise.
I’ve mentioned before that it’s almost like we can see home buyers become more sensitive to the changes in rates than to the absolute level of the rates themselves. So the change from 7 to 7.5% would be really shocking. In September 2022, we could measure an immediate spike in the inventory on the market when that happened. That’s very unusual to have inventory building that late in the year.
Independence week of 2022 was the moment when transaction volume began to fall precipitously. Transaction volume fell again in September with the second mortgage rates spike of the year. As the sales rate recovered somewhat in 2023, there are now just 9% fewer homes in contract than there were in 2022 at this time. Remember 2023 began with 35% fewer homes in contract.
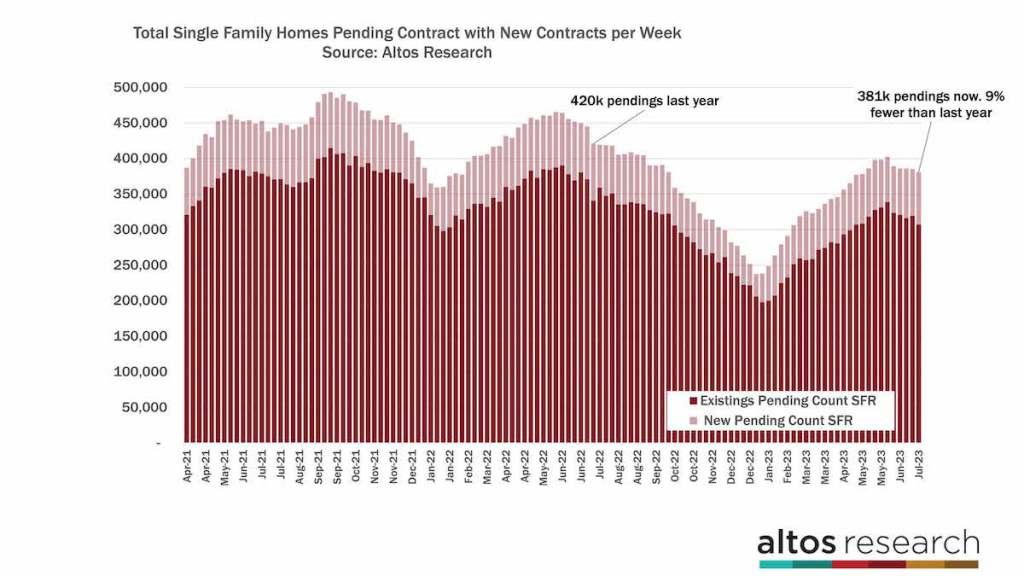
In the chart above, the height of each bar represents the total count of homes in contract. The data shows last year had a big dip over the holiday to 420,000 single-family homes that were in contract. The week was the start of the steep decline in transaction volume in the second half of the year. The light portion of the bar is the new pending sales each week. There are now 381,000 single-family homes in the contract stage, with 74,000 new contracts this week. That is the most new sales in any week of this year. It’s 8% fewer than in 2022, so the sales rate gap is still closing from last year. And so far, even at 7% mortgage rates, that sales trend is holding up. The comparison gets easier every week from here on out. In 2022, the sales rate dropped dramatically each week.
You can see another dip in the sales volume in September 2022, exactly when mortgage rates jumped to 7.5%. This is where we’ll want to keep our focus since rates are persistently above 7% currently. If mortgage rates go up from here, you’ll see the impact very quickly in this pending sales data. We might lose ground again. We’ll keep this chart updated in the coming weeks to see what we learn about home buyers’ reactions to the latest surge in mortgage rates.
Prices
Price reductions are doing their seasonal climb. Homes that have been on the market and not receiving offers will start to cut prices later in the summer. If demand weakens, then there will be slightly fewer offers and slightly more price cuts. I’ll be really interested to see what happens in the next two weeks with price cuts.
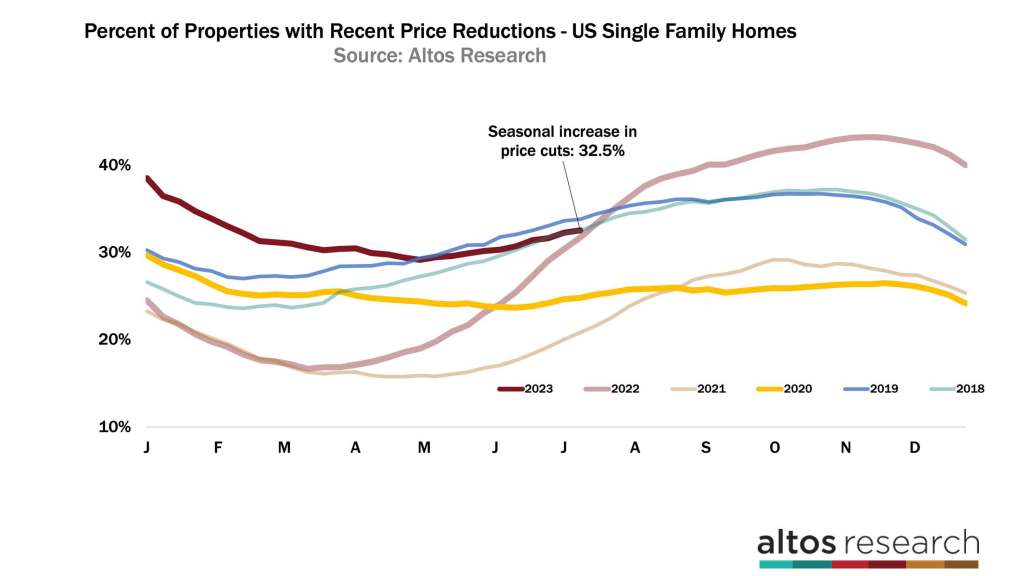
Right now, 32.5% of the homes on the market have taken a price cut. There’s been more demand than the quantity of homes available so relatively few sellers have had to cut prices. But that can change quickly. Home buyers are very sensitive to changes in affordability. And sellers will see it quickly. You can see the trajectory of the dark red line here. That’s the curve of price reductions for the year.
The curve in 2022 was climbing so quickly, that’s how you measure demand cooling. Demand has been accelerating this year. At least for the few available homes. You can see that there are buyers at these home prices and at these mortgage rates. Keep your eyes here especially if rates climb again.
The median home price in the U.S. is $452,490 this week. That’s half a percent lower than last week. And also half a percent lower than in 2022. It’s very common for the last week of June to be the peak of home asking prices and it looks like this year is no exception. Home prices are flat year over year and there’s no indication anywhere in the data yet that home prices are falling from here. I’ve been highlighting in this video all the places where we can see home buyer demand be sensitive to affordability changes. But as of right now, demand has been sufficient to keep home prices supported.
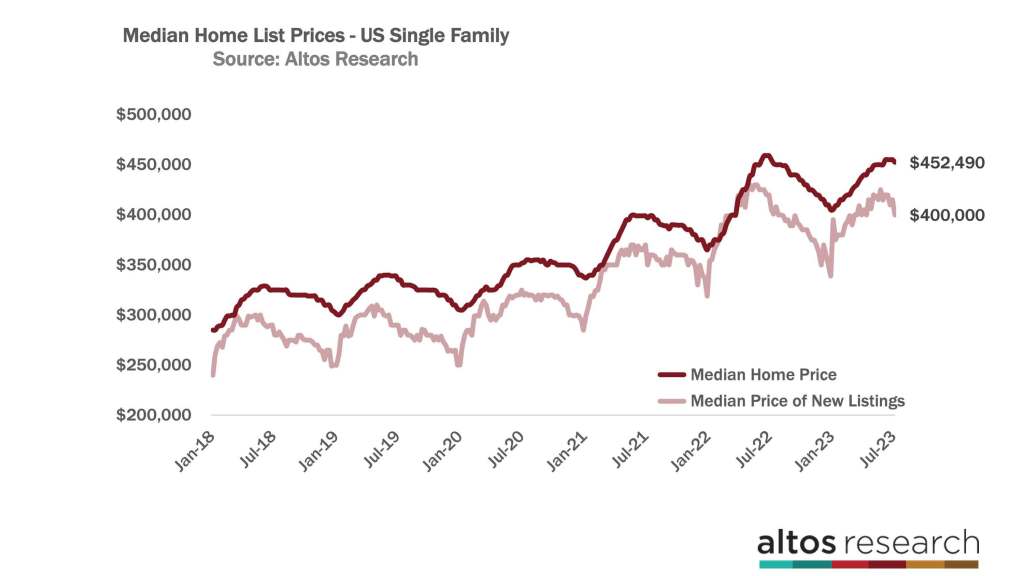
Both the median price of all the homes on the market and the median price of those new listings this week are slightly below 2022 at this time. The median price of the new listings is $400,000. The new listings that come on the market over the holidays always have a little discount. Generally the price of the new listings declines in the second half of the year. The price decline from 2022 is represented in the light red line. It was particularly steep, so there’s a good chance that list prices will be up over last year sometime in July and finish 2023 with positive home price appreciation over 2022. At the beginning of the year I would have guessed that was very unlikely, but here we are.
In fact, if we look at the prices of the homes that people are buying, we can see the median price of the newly pending sales is up again this week and homes are going into contract at higher prices than those from 2022. That’s very consistent now, several weeks in a row. And frankly the annual price comparisons get another huge boost in September.
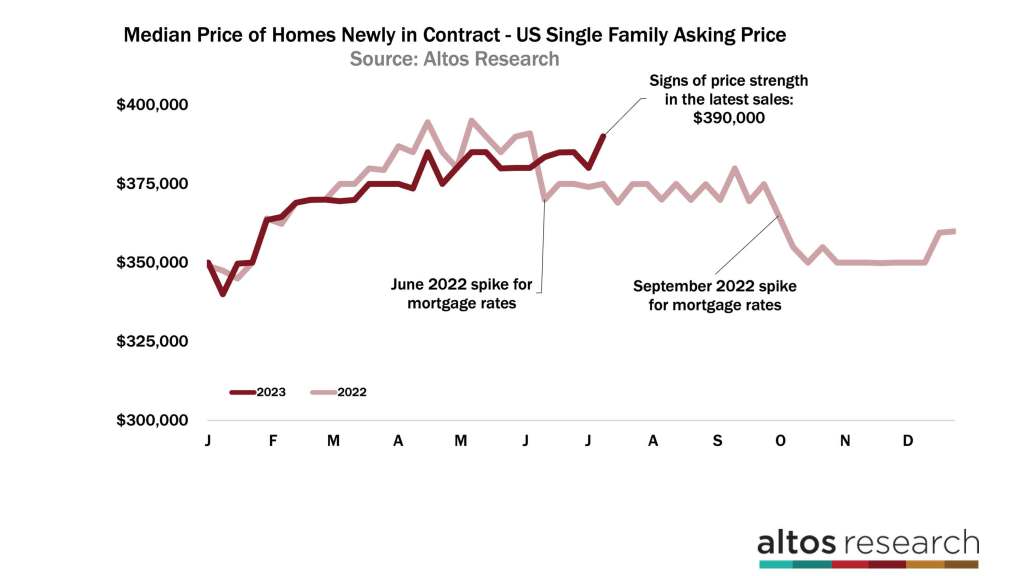
This chart is the median price of the newly pending home sales each week. The dark red line represents 2023. The median price of those new pending sales is $390,000 this week. That’s the highest sales price of the year. And just a tiny bit below the record sales price set in June 2022. The light red line represents 2022. You can see home sales prices took a drop in June and again in September of 2022.
No matter where you look in the data home prices are flat from 2022. The trends are showing moderate price strength, especially compared with last fall. That means that home buyers are buying at these prices and these mortgage rates. But we also know that mortgage rates have jumped over 7% because the economy has been so strong. What if mortgage rates go to 8%? Well we should see it quickly in the price reductions, in the inventory count, and in the sales prices.
Mike Simonsen is the president and founder of Altos Research