Even as mortgage rates climbed over 7% in the past six weeks, home prices have not declined. But, we can see slightly fewer purchases happening. As demand dips, the prices are not. As a result, the available inventory of homes for sale is slightly higher each week. Not a lot higher, but inching up.
Mortgage rates are sitting at their highest levels in many years. Earlier this year, it looked like rates might ease back down a bit, but for a month and a half, they’ve bounced up. The surprisingly strong economy has the markets assuming the Fed will keep rates higher for longer, therefore, mortgage rates follow suit. Higher mortgage rates mean higher monthly payments, less affordability for home buyers and slightly fewer transactions. With fewer transactions, inventory is building just a bit as we approach the end of the summer. When will inventory peak for the year? There should be a few more weeks at least. Then, Altos will be on watch to see if another boost in mortgage rates — like last September — derails the real estate market again.
Inventory
Inventory is still climbing just a bit each week as we approach the end of the season. There are 488,000 single-family homes on the market now, that’s an increase of less than 1% from last week. There are 10% fewer homes on the market now than there were in 2022 at this time.
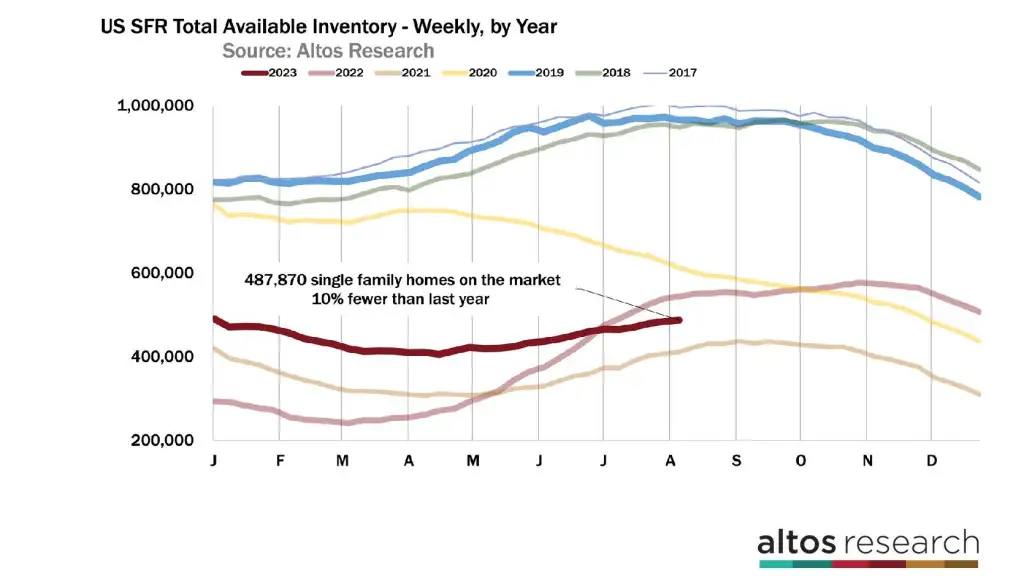
I expect inventory to climb for another three weeks until the end of the month. I also expect another 1% inventory growth this coming week. Then, the pace will level off and start to decline in September.
It’s pretty common for inventory to peak during the last week of August. In fact, in 2022 inventory had also peaked in August, rounded the top and started declining for the fall when interest rates spiked in September. So, the number of homes on the market in 2022 increased in September and October which was very unusual. If rates jump again this fall, I’d expect the same behavior. The data shows that unusual increase in inventory in the chart above. The light red line represents the August inventory. It started curving down, but in September the buyers stopped and inventory surged. In 2022, inventory peaked during the last week of October. Compare that to this year’s curve and you can see how we’ll end 2023 with probably 20% fewer homes on the market than there were in 2022.
I’ve said this before and I’ll repeat: consumers are more sensitive to the change in the mortgage rates than in the absolute levels. Mortgage rates are over 7% now, and the data shows slow demand. In 2022, rates jumped from the low 6% range to 7.5% in just a few weeks. It was that jump that stopped any buyers cold — the moment of change where people stopped buying. Those buyers stopped, so inventory grew late in the year. Now, rates are at 7% but they’ve been at this level for basically the whole year. So while demand is slow, it isn’t falling. I haven’t seen any indication that mortgage rates will drop from here, but if they did, buyers would respond and the available inventory of unsold homes on the market will fall too.
It’s no secret that sellers are absent in this market. Each week there are only 61,000 or 62,000 single-family homes that hit the market anywhere in the U.S. It was at this point in 2022 when new listings started plummeting each week. In September, even though new sellers were few, buyers were even fewer, so inventory rose. I’ve highlighted September 2022 in the chart below. Through July, new listings volume each week was in the normal range as in previous years. Suddenly new listings volume dropped each week. That was the same time when buyers stopped of course. At the time I focused on the buyers — on only the demand side of the equation. I began to get bearish on home prices in 2023. Had I been more wise, more attentive, I could have seen the seeds of this year’s low-supply crisis being sown as early as August 2022.
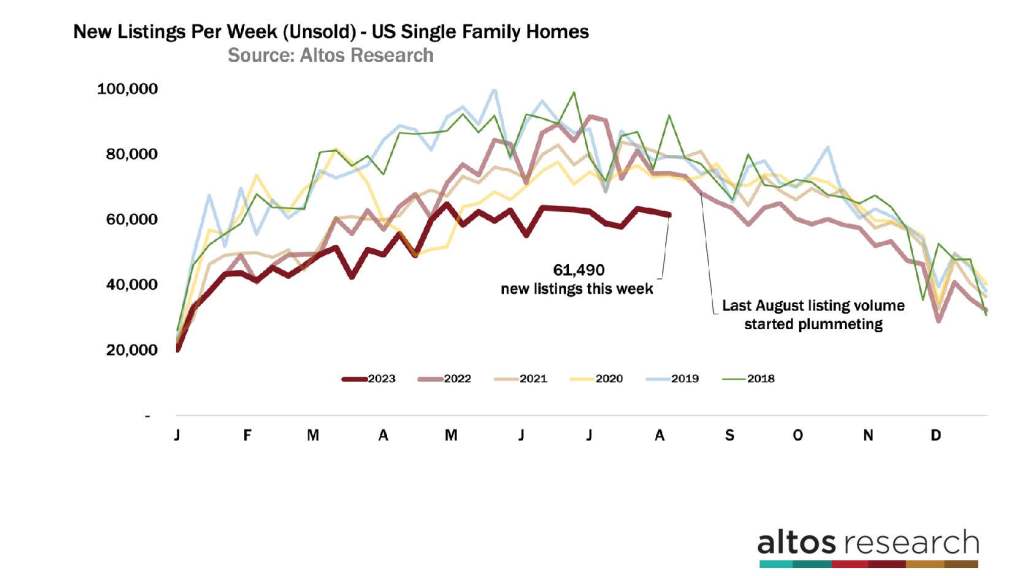
The dark red line on this chart represents dramatically fewer new sellers each week than in normal years.
The important takeaway in the new listings data is that there is still no sign, anywhere in the data, of a surge of sellers. There is no sign yet of inventory growing substantially in the near future. There are no AirBnB bust owners unloading in bulk. Investors aren’t panicking. There are no homeowners distressed and unable to pay their mortgages. In 2022, the data started to show this trend, and there were still lots of people who were assuming a bubble burst scenario was playing out — that there would be tons of supply, weak demand and plummeting home prices. None of those fears played out of course.
But the economy could still tank from here. We can’t assume that the market won’t change. If some of these classes of homeowners need to unload, if some of the fears about the housing market start to finally happen, it will appear very quickly in the weekly new listings data. As of right now, there is no sign of any surge in new listings.
That brings us to the pace of sales. The market is still running below the pace of new contracts each week in 2022. There are 5% fewer sales now than in 2022 at this time. Even while the sales rate was tumbling in 2022, there are still fewer sales now. Demand by buyers is low of course, but as we just saw, this is a supply-constrained market. We have so few new listings each week, it’s impossible for the sales rate to climb.
As long as mortgage rates stay at or above 7%, you can easily see how the slow sales rate will continue. Maybe in September or October, if we’re lucky, the sales rate will start coming in higher than the abysmal rate at the end of 2022.
Pending Sales
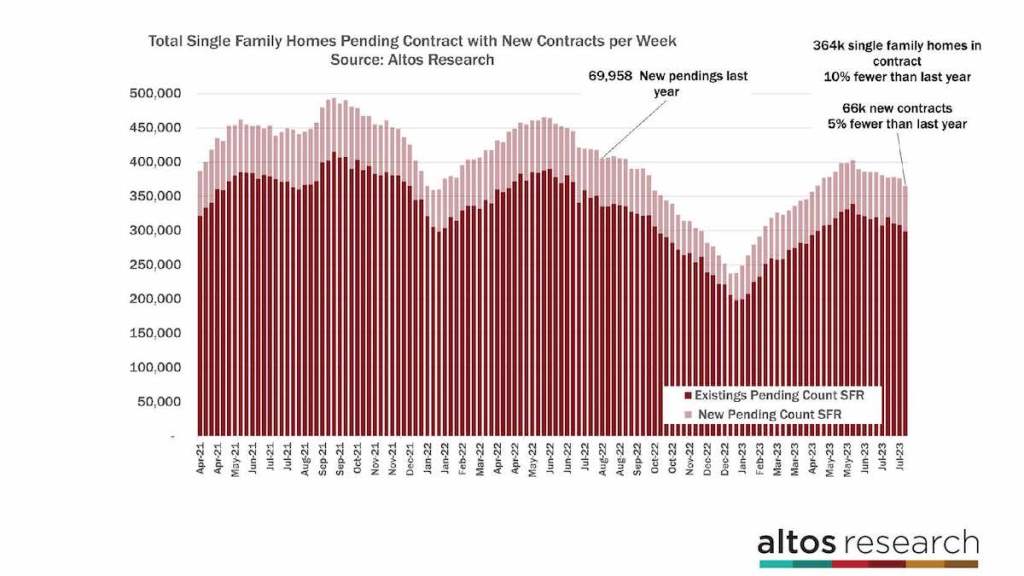
Because we’ve had these surprising green shoots in the housing market all year, I’ve been looking for signs that transaction volume would pick up, maybe that we’d end 2023 stronger than 2022. But consumers are very slow to buy at 7% mortgage rates and that shows no signs of changing. There were 66,000 new pending sales this week with single-family homes across the U.S. That’s 5% fewer than in 2022 and 25-30% fewer sales each week compared to 2021. That sales rate is just showing no signs of growing. There’s no inventory for buyers to buy.
One implication is that you should expect downward revisions in the forthcoming NAR pending sales reports over the next few months. We’ve been at 4.2 million seasonally adjusted sales rate, and I could see that sliding closer to 4 million. In this chart, the height of each bar represents the total count of homes in contract in a given week. The light portion of the bar represents the new contracts that week. There are 10% fewer homes in contract pending than in 2022 at this time. 5% fewer new contracts this week. Maybe by September, there will be more home sales so that the fourth quarter of 2023 is a little stronger than Q4 2022.
Prices
Home prices, meanwhile, are flat to a little higher than in 2022 at this time, depending on how you measure home prices. The median price of single-family homes in the U.S. is $450,000 right now. These are all the homes that are available to purchase. You can see in the dark red line at the far right end of the chart that prices are just off their seasonal peak and just below the all-time high set a year ago in June. Home prices tend to cluster around the big round numbers like $450,000, so it’s not uncommon to have several weeks where the median price is unchanged right at $450,000 or just a fraction below. Lots of properties get priced at the threshold so that buyers searching with an upper bound of $450,000 will see them. There are very few $451,000s and a lot of $449,000s.
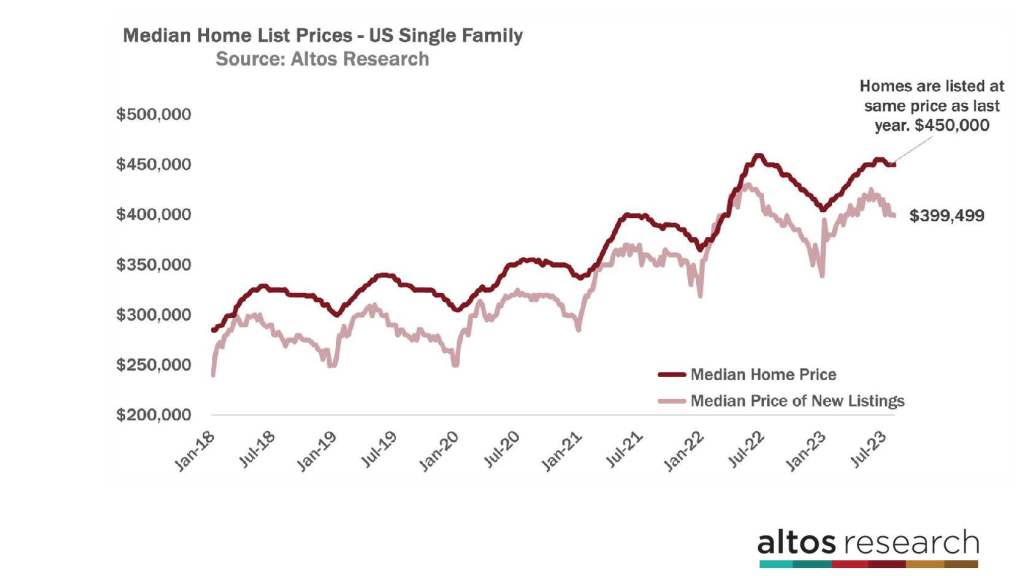
We can already see that home prices will have normal seasonal pressure to decline over the rest of the year. These are normal seasonal changes. Compare that trend to 2022 when you can see how steadily prices ratcheted down week after week last year. There’s no indication in the data that home prices will drop like they did late in 2022.
One of the places we see those leading indicators is in the median price of the newly listed properties each week. The sellers and listing agents in aggregate know exactly where the demand is for their new listings, so we can use those changes to know where future sales prices will be. The newly listed cohort this week was $399,499. The light red line is off the peak from earlier in the year. In 2022, it was way off already and dropping quickly each week. That’s not happening now.
Examine the middle of the chart to see how the light red line in 2020 and 2021 stayed elevated late in the year. At that time, there was demand by buyers who kept pushing home prices higher. There isn’t upward price pressure right now, of course, but it’s always useful to keep your eyes on the price of the new listings to watch for the next shift in demand.
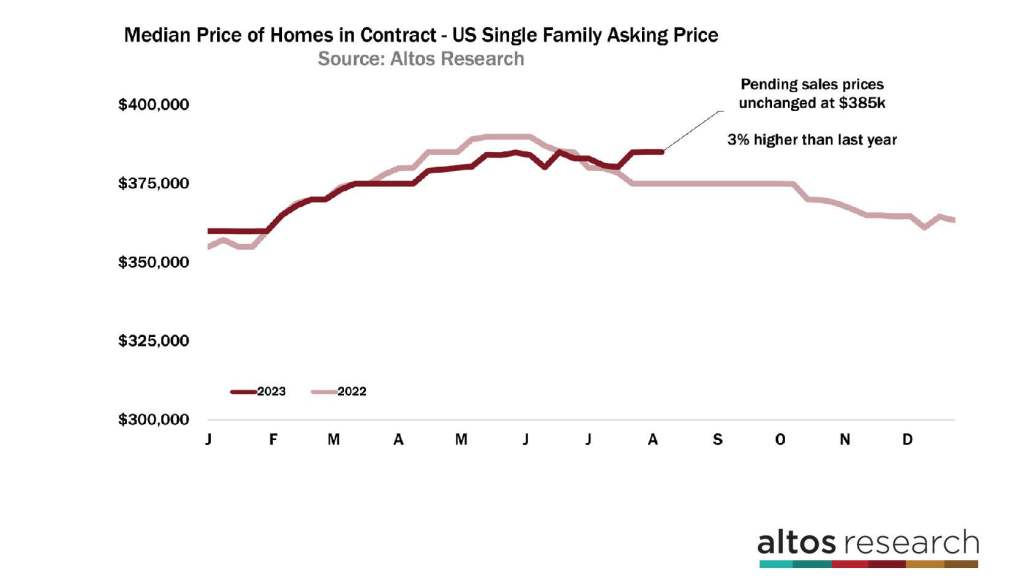
The median price of the homes in contract show that the sales prices are coming in just about 3% higher than in 2022. The median price of the homes in the contract pending stage is unchanged this week at $385,000. That’s 3% higher than 2022 at this time when prices were plateaued at $375,000. The data shows this year’s dark red price line is now consistently above the 2022 light red curve. Home prices fell in June and July 2022 as the market finally swallowed the COVID-19 pandemic buying frenzy, and cheap money was gone forever. Home prices fell in the fourth quarter of last year with that late summer surge in mortgage rates.
If you are communicating with buyers and sellers about price expectations — maybe there are buyers on the fence waiting for home prices to drop, it’s probably wise for them to see that there is no sign of prices dropping. Likewise, if you have sellers who need to not panic about how much they can get for their home, this is really important data for them to see.
More next week.