State Migration Study Finds Americans Are Moving South
A LendingTree study looked at where people moving out of state are going — and discovered that of the 12.1 percent of homebuyers across the country who change states, most prefer to head south.
LendingTree reviewed over 2 million new purchase mortgage loan requests for primary residences in all 50 states in 2018 (through mid-November) to find what percentage of all requests were from residents looking to move outside of their current state, and where their destination would be. The results reveal the most popular new locations for homeowners in each state, along with the states with the highest percentage of requests to move to other parts of the country.
Key Findings
Florida is the No. 1 destination.
Florida was the top new destination for 15 of the 50 states. Of all purchase mortgage requests during the study’s period, 9.1 percent were for Florida. For out-of-state movers, 12.4 percent of requests were for Florida. The Sunshine State has a long history of bringing in visitors and new residents, particularly retirees.
Texas residents love the Lone Star State.
Texas had the highest percentage of residents looking to move within state lines — 93.4 percent of purchase mortgage requests from individuals in Texas were for properties in the same state. Texas is also a top destination for people moving from out of state, claiming the top spot from six states. Michigan was the state with the second highest percentage of residents looking to move within its borders, at 91.3 percent.
Alaska has the most residents looking to move away.
By contrast, Alaska had the lowest percentage of residents looking to stay in state at 75.2 percent. The top destination out of Alaska was Washington state.
Most people looking to move out of state don’t want to go far.
More than half of the most popular new destination states border the current state. But if they are looking to move cross-country, chances are it’s to Florida. Of the 20 states where the residents’ most popular new location does not border their current state, 13 were Florida.
South Carolina is the top destination when adjusted for population size.
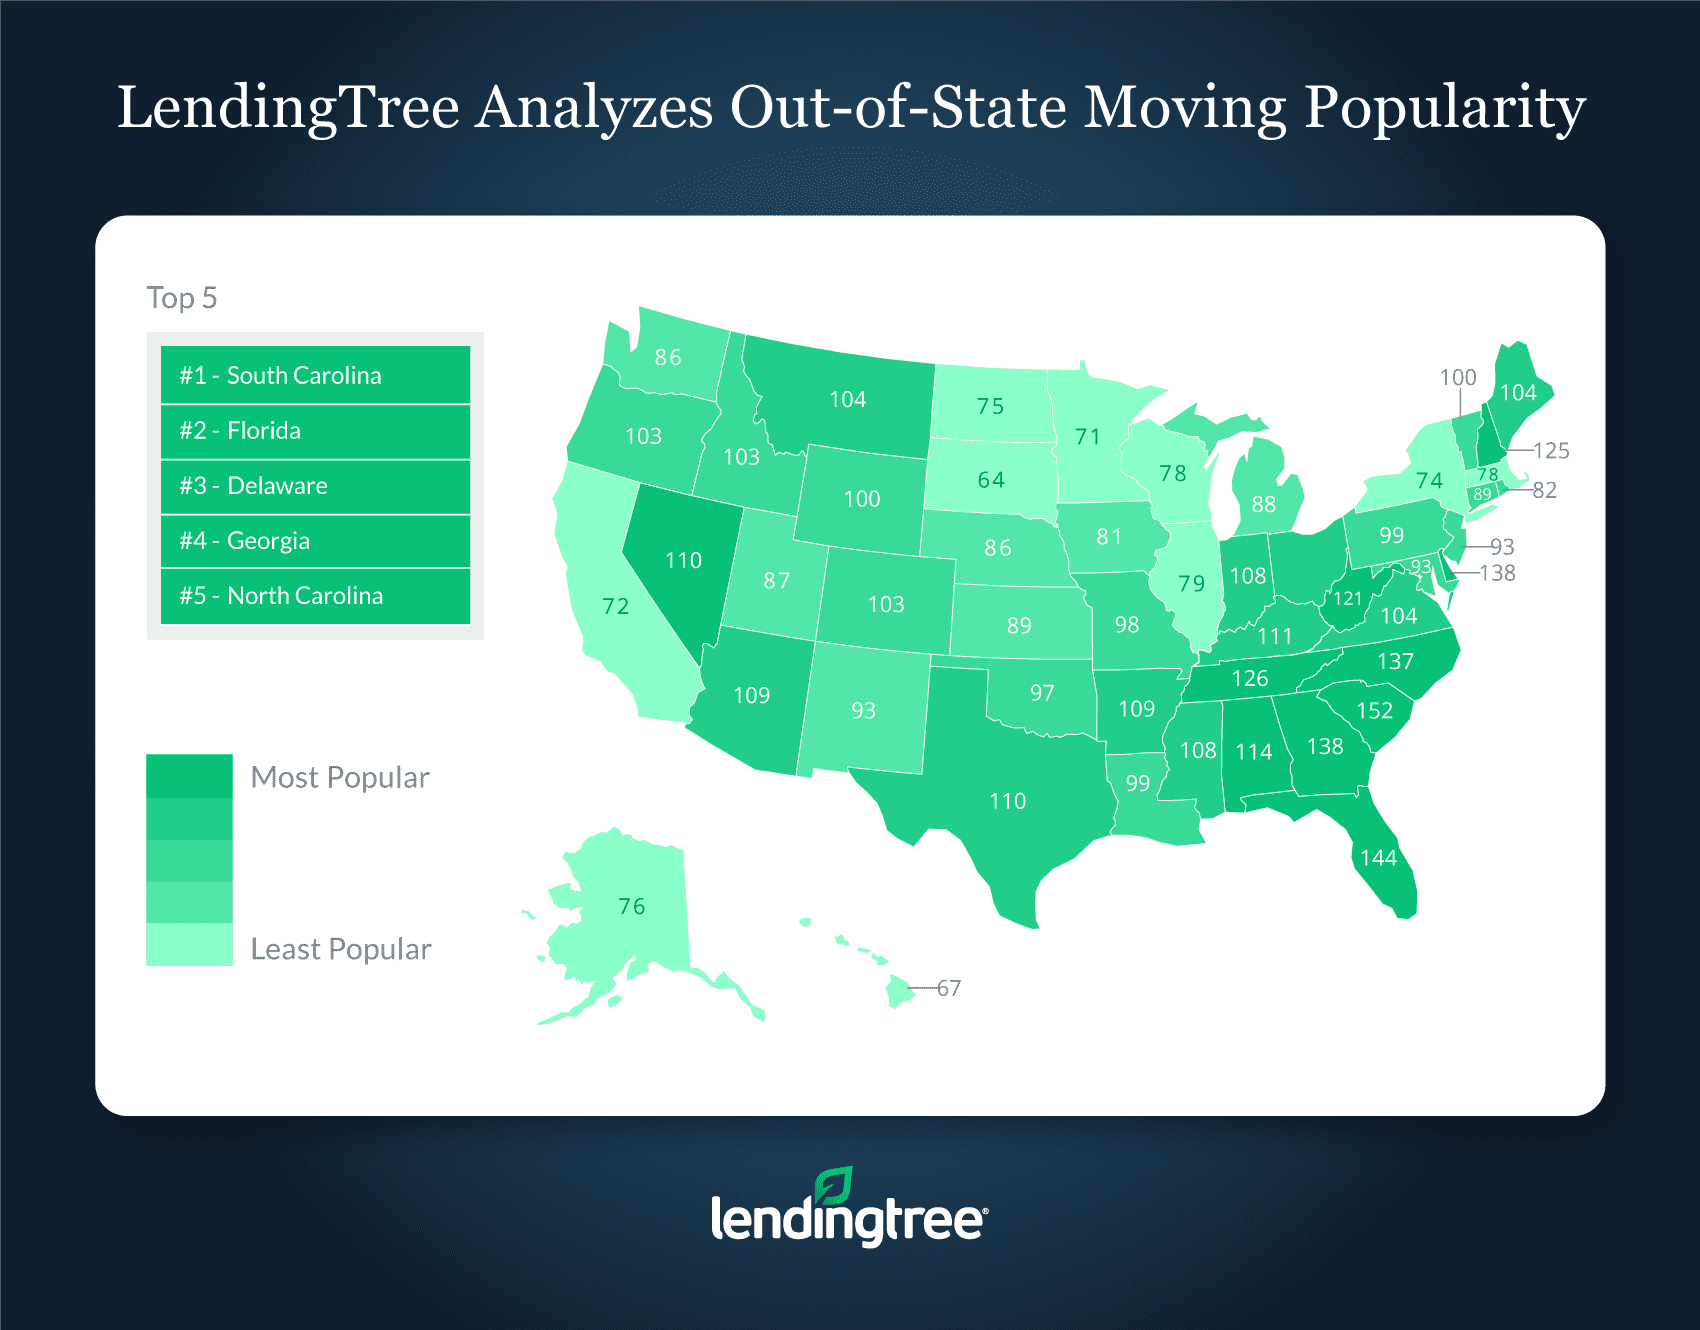
LendingTree created a Moving Popularity Score Index* to analyze destination states adjusted by population. South Carolina scored highest, as mortgage loan requests from out-of-state movers were 52 percent greater than suggested by its share of the national population. Other popular states by this metric are Florida, Delaware, Georgia and North Carolina, revealing a Southern tilt in the preferences of out-of-state homebuyers. At the other end of the spectrum, homebuyers are least attracted to South Dakota, which received just 64 percent of the loan requests its population would suggest. Hawaii, Minnesota, California and New York complete the bottom five.

*Moving Popularity Score Index methodology
The popularity score for each state was created by dividing the percentage of all out-of-state purchase mortgage requests for the state by the percentage of the total population each state represents. A score of 100 means a state receives loan requests proportional to its population, above 100 means a state is more popular than its share of the national population and below 100 means a state is less popular than its share of the national population. For example, South Carolina represents 2.40 percent of all out-of-state mortgage requests, and its population is 1.54 percent of the nation. So, the South Carolina score is 2.40/1.54 x 100, or 156.


