


West Region leads U.S. in showing activity with double-digit gains; other regions exhibit substantial growth
Key Points:
- Lack of inventory continues to present market challenges as homebuyer demand increases throughout the U.S. and new listings are not coming on the market fast enough to meet demand
- West (11.9 percent), Midwest (5.8 percent), South (4.7 percent) and Northeast (4.2 percent) regions all record year-over-year gains to open the year
- Concern over interest rates and the new Federal tax picture have grown according to reports, though neither appear to be inhibiting homebuyers
- ShowingTime combines showing data with findings from its MarketStats division to provide a set of benchmarks that track demand for active listings throughout the country
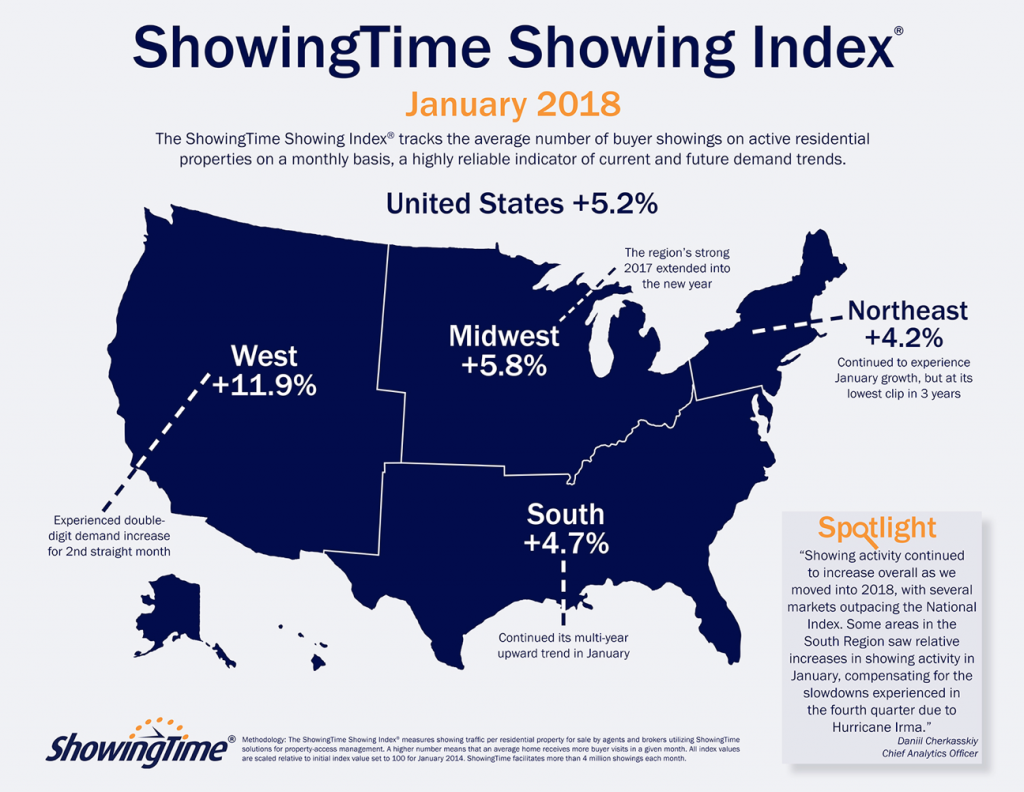
The ShowingTime Showing Index®, a leading indicator of confirmed homebuyer demand, revealed that home showings on the national level posted a 5.2 percent year-over-year increase in January as 2017’s high consumer demand continued into the new year.
All four regions experienced growth from the previous January, with the West Region seeing an 11.9 percent year-over-year increase in buyer interest. The Midwest (5.8 percent), South (4.7 percent) and Northeast (4.2 percent) regions also saw an increase in showing activity compared to the same period last year.
ShowingTime Chief Analytics Officer Daniil Cherkasskiy said January’s increase in showing activity is a direct reflection on buyer demand continuing to outpace inventory.
“Showing activity continued to increase overall as we moved into 2018, with several markets outpacing the National Index,” Cherkasskiy said. “Some areas in the South Region saw relative increases in showing activity in January, compensating for the slowdowns experienced in the fourth quarter due to Hurricane Irma.”
Although a number of real estate experts have adopted a “wait and see” perspective on the potential impact of a revised Federal tax plan, this early indicator shows that consumers are potentially moving ahead regardless.
The ShowingTime Showing Index, the first of its kind in the residential real estate industry, is compiled using data from property showings scheduled across the country on listings using ShowingTime products and services, which facilitates more than 4 million showings each month. It tracks the average number of appointments received on an active listing during the month. The Showing Index, released the third week of each month, will eventually be released on a weekly basis. Local MLS indices are also now available for select markets, and are distributed to MLS and association leadership to provide them with another resource to share with members and to communicate to local media.
To view the full report, visit www.showingtime.com/index.
About ShowingTime
ShowingTime is the leading market stats and showing management technology provider to the residential real estate industry. Its MarketStats division provides interactive tools and easy-to-read market reports for MLSs, associations, brokers, agents and other real estate companies. Its showing products and services take the inefficiencies out of the appointment scheduling process for real estate professionals, buyers and sellers, resulting in more showings, more feedback and quicker sales. ShowingTime products are used by 180-plus MLSs and associations representing more than 900,000 real estate professionals across the U.S. and Canada. Visit www.showingtime.com.
