


One way to measure supply and demand in residential real estate is to track what Altos calls the ‘immediate sales.’ These are the homes that get listed and take offers immediately, often within hours of listing and then go into contract. These homes spend essentially no time on the market. During the COVID-19 pandemic frenzy, as many as one-third of all new listings were in contract essentially immediately after listing. In 2022 at this time, the number of immediate sales was plummeting.
But on the supply side, even as the market cooled in 2022, the new listing volume was actually still slim. Supply was still constricted with barely 100,000 single-family homes hitting the market in a week.
It’s this supply-demand dynamic that we’re seeing play out in 2023. There are very few sellers so there are enough buyers available. Despite mortgage payments being much higher, home prices haven’t come down.
Inventory
There were just 420,000 single-family homes on the market in the U.S. last week. That’s basically unchanged from last week. The fact that inventory still isn’t increasing measurably by mid-May is really notable. In 2022, inventory was climbing by 4-6% per week. The light red line in the chart below shows how steep the climb was. Previously, Altos has talked about the abrupt pullback in buyer demand in 2022, and how that allowed inventory to finally build. This year is different.
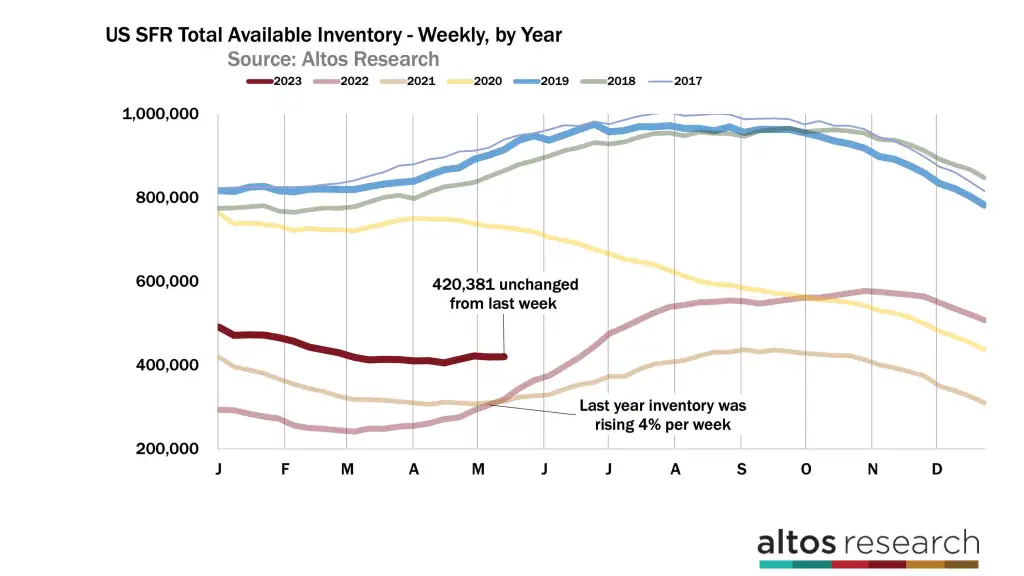
At the time, we assumed that the climbing home supply trend would continue into this year. At the start of 2023, our model expected that we’d have over 600,000 homes on the market now. Instead, it’s closer to 400,000. I was just way off in my expectations. What happened? Well, for one thing, buyers seem to be making the calculation that if they can afford their payments now then they can wait for rates to go down in the future, and their homes will only get less expensive. Since the economy has been throwing recession signals for over a year now, Altos had also factored that into inventory forecasts. But the economy hasn’t slowed appreciably yet. Employment is still at record-high levels, so we still have home buyers.
There are 32% more homes on the market now than in 2022 at this time. Last week it was 37% more. The gap from last year is shrinking so rapidly. It looks like we’ll be back to negative year-over-year inventory changes by the third quarter. Active inventory looks to end 2023 with under 500,000 homes on the market. Shrinking inventory year over year is generally correlated with rising home prices another year out. So 2024 is shaping up to be an up year for home prices. At least that’s how the data looks now. A lot of external factors can hit between now and then of course. Bank failures, big recessions, wars. None of those future possibilities are in the data yet, because home buyers act on their situation now. And that situation looks pretty good.
Demand
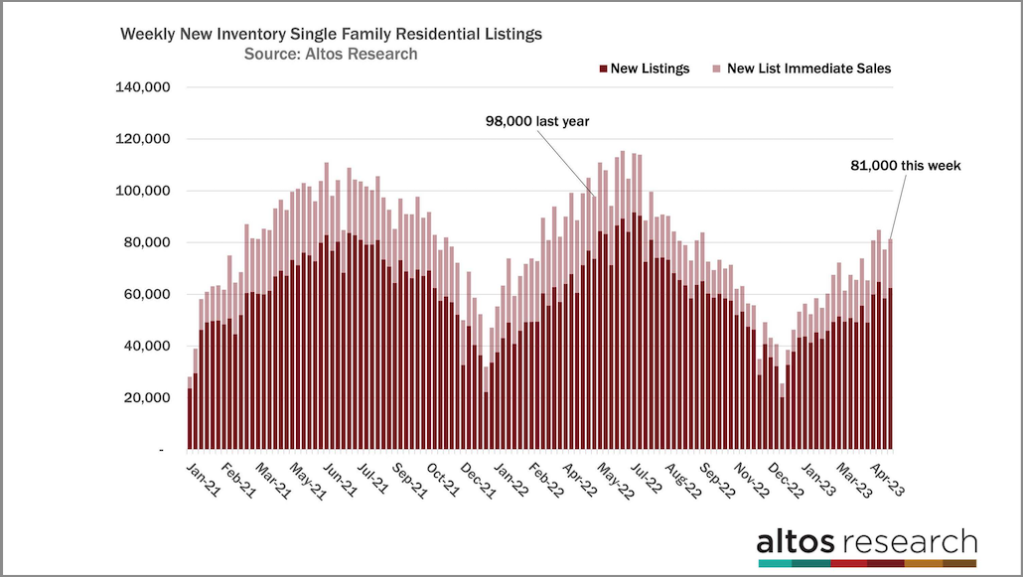
There were never really a lot of sellers — even when inventory was skyrocketing in 2022. That’s why we call this a supply-constrained market. There were 100,000 new single-family listings each week at this time in 2022. That’s only a 5 million annual pace. So even in 2022, it was a supply-constrained market. Now it’s even worse. This week there were only 81,000 new listings, 17% fewer than in 2022 at this time. And 19,000 of those listings are already in contract. Those are the immediate sales. In the chart below, each bar represents the number of new listings — the taller the bar the more sellers. The light part of the bar represents those immediate sales. This tells us that there continues to be plenty of demand for the current level of housing supply.
In order to tease out the demand trend and analyze how different the demand is now compared to May 2022, I’m looking at the immediate sales as a percentage of the total new listings data. This week, 23% of the new listings went into contract essentially immediately. That means fewer bidding wars and multiple-offer scenarios than during the COVID-19 pandemic, but look at how rapidly this demand indicator was falling in 2022 at this time. See the steep decline in the middle of the chart? You can also see in this chart how the demand slowed again last fall when rates did their final jump over 7%. Buyer activity stopped and inventory started rising again. Now, at the right end of the chart, it shows how demand has remained at this healthy clip.
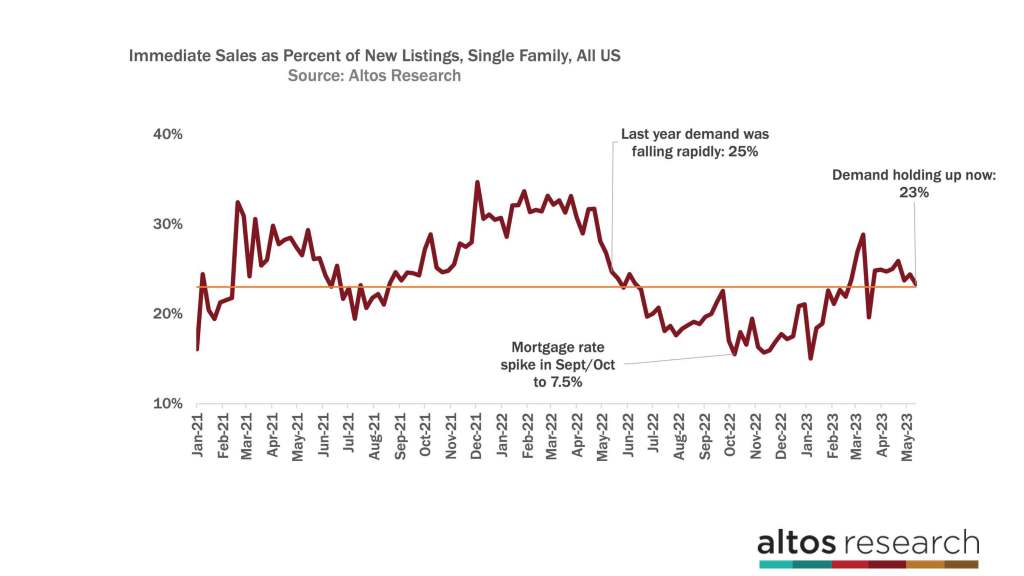
Use the rate of immediate sales if you’re looking for signs of a slowing economy that curbs the current buyer enthusiasm. This data can confirm or reject that hypothesis.
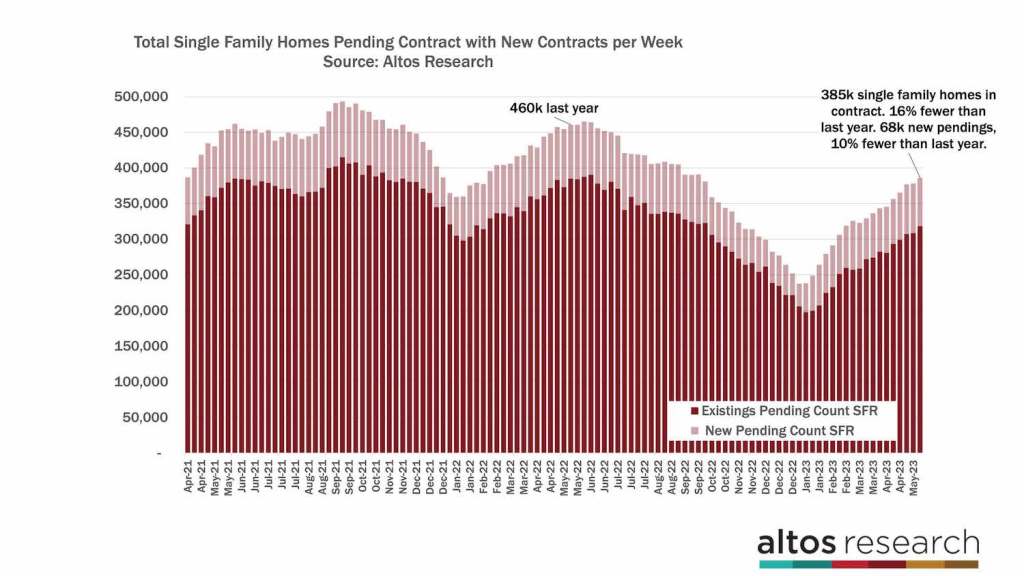
While we’re on the topic of demand, the data shows that the number of homes under contract is steadily rising. There are 385,000 single-family homes in contract — up a couple of percent from last week and still 16% fewer than in 2022 at this time. 16% fewer homes are scheduled to close. Per this trend, in the third quarter, we’ll have recovered that gap and could have more homes under contract again.
Pending Sales
In the chart below, the hight of each bar represents the total number of single-family homes in contract. The light portion of the bar represents the new pending sales that week. There are 68,000 new pending sales this week, which is 10% fewer than in 2022 at this time. 16% fewer total but only 10% fewer new sales. Each week we get a little closer. After July, the yearly comparisons start to get really easy.
The price of the homes under contract is $384,130. That data point is staying 1-2% below 2022 data. These are the homes in contract, whose sales will complete in May and June. Since we already know these contract prices are lower than they were in 2022, we know that the sales prices when the sales are complete will be lower too. But that probably changes in the third quarter too.
Price
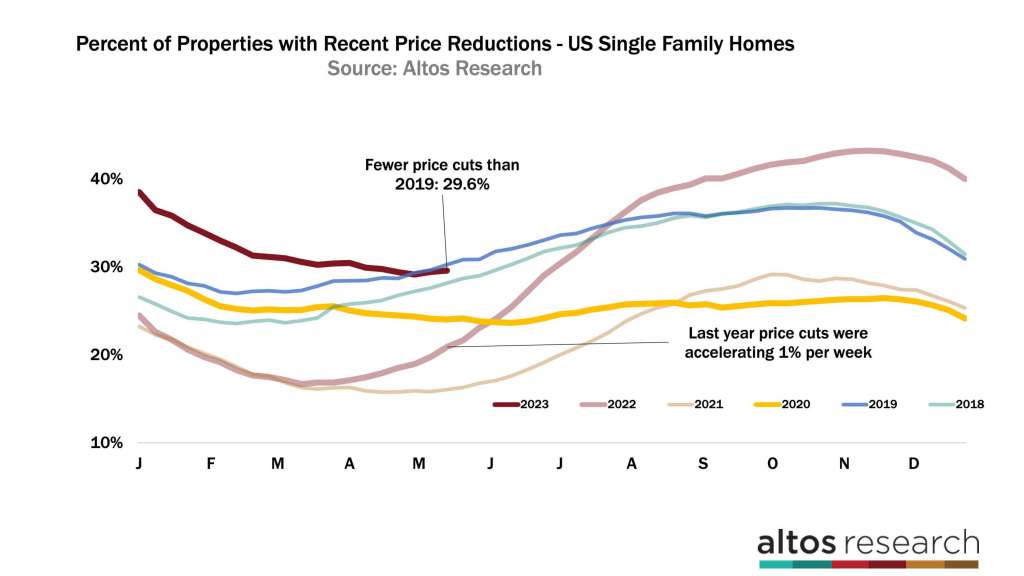
Along with immediate sales, price reductions are an excellent proxy for housing demand. Altos has been talking about how quickly price reductions have been falling since the beginning of 2023. Price cuts ticked up this week to 29.6% and it’s totally normal for price cuts to be increasing now, but they’re not accelerating. This data shows more steady demand for homes on the market. There are fewer homes with a price cut today than in 2019. In 2022 at this time, price cuts were accelerating by thousands of homes each week. They weren’t getting offers. Again, this is another signal of how different this year is and why we don’t have further price pressures.
Let’s finish with home prices this week. The median price of single-family homes in the U.S. is $449,913. That’s basically unchanged from last week. When you look at all the homes on the market, asking prices are still a tiny fraction higher than in 2022 at this time. I’ve been trying to consistently illustrate this for folks — home prices are not falling. The in-the-know observers of housing are onto the data now. Even if the headlines will still talk about home price declines for several more months.

The median price of the new listing is increasing too! It is 2% lower than last year at this time. In most years, the last week of May is the peak for the light red line in this chart. In 2019, after interest rates rose and inventory was slightly higher, the price of the new listings peaked in April. The best inventory gets listed by May, to take offers in June to close in July. If you’re listing later in the summer, now you’re running into August and school time transitions. So the new listings prices peak in May. They can stay around that peak for all of June. This is a leading indicator of future sales prices, so last year as demand cooled, the new listing prices fall pretty quickly starting in June. So, we’ll keep our eyes on this metric next month to see if we regain price strength from the previous year. Right now, the price of the newly listed homes for sale is just about 2% lower than it was in 2022.
More next week.
Mike Simonsen is the founder and president of Altos Research.
