


The first half of 2023 is complete. This week is, in many ways, the turning point for the year. The data shows purchases start to slow down, prices decline and inventory should peak soon. The best inventory gets listed in the first half of the year. The later in the summer you list, the more likely the property will have a little discount to make sure the house isn’t sitting on the market after school starts — or even later as we approach the holidays.
This year has had some big surprises of course — six months ago we expected an extension of 2022 where inventory would keep rising due to ultra-slow demand. But demand stabilized and new supply was even more rare, which led to declining inventory and home prices holding up.
Mortgage rates seem to be climbing again though, and consumers are definitely sensitive to the affordability challenges that creates.
What will it take for inventory of homes to build for the second half of the year? If mortgage rates climb, demand will slow and inventory will build up, like it did in September and October of last year. If mortgage rates stay under 7% or ease lower, homebuyer demand will increase, available inventory will shrink and home prices will have even more support than we’ve already seen in 2023. This is important to pay attention to, because conventional wisdom right now suggests that a return to lower mortgage rates will bring new inventory. But the data tells us that lower mortgage rates actually decrease inventory.
Inventory
There are now 467,000 single-family homes on the market around the U.S. That’s 2% fewer than in 2022 at this time. In 2022, inventory was climbing by 4-5-6% per week. Last year the story was how much demand had slowed, this year the story is how new supply has ceased. While demand for homes isn’t great, it’s been obviously greater than the quantity supplied.
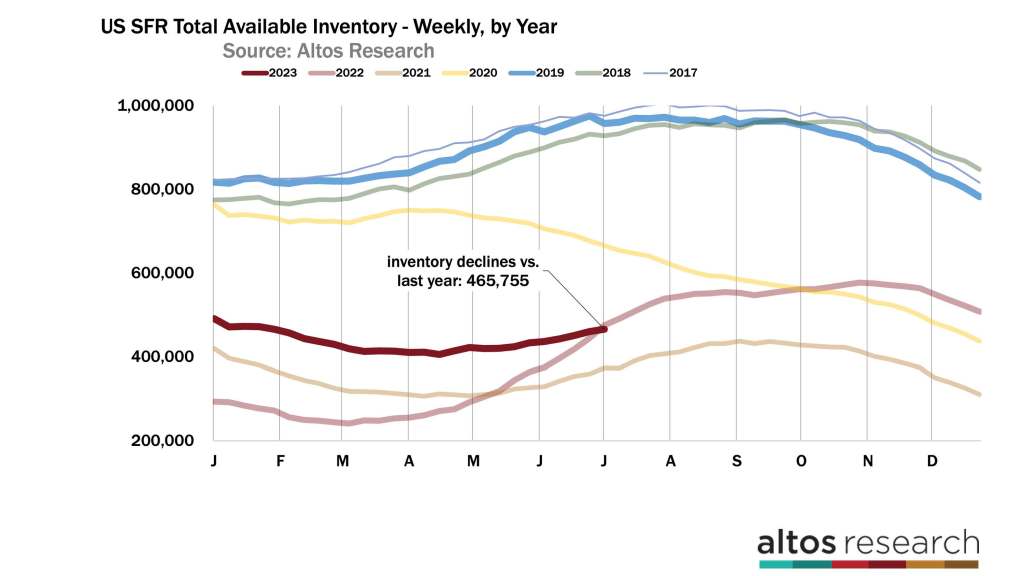
Now, as we roll into the second half of 2023, the data should report if mortgage rates over 7% slow the market again like it did in 2022 and let inventory build or if sellers remain scarce and inventory starts falling again. Peak inventory is usually in July or August, but that will depend on several variables. In 2022, inventory didn’t peak until late October. As of right now, it looks like the year will end with 15% fewer homes on the market than at the end of 2022. Home buyers are keeping prices elevated by buying all that is offered at these prices and these mortgage rates. Lower rates mean lower inventory. Higher rates mean greater inventory. I’ve been harping on this message lately. I think it’s a misconception that we need lower mortgage rates to get more inventory. The data shows that it’s the other way around.
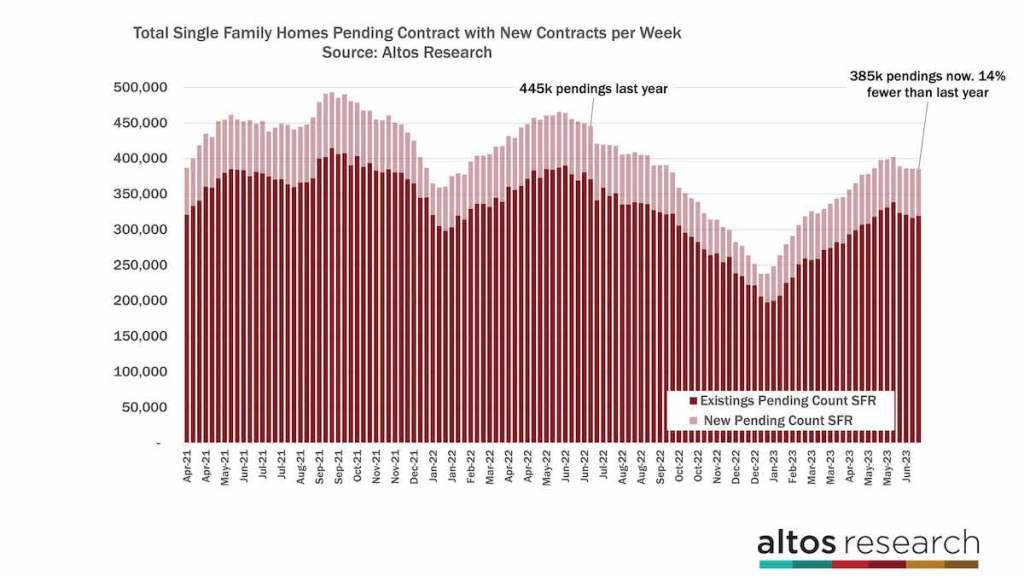
The rate of home sales has peaked for the year as well. There are 385,000 single-family homes in contract. That’s 14% fewer than at this time in 2022. The percentage of fewer sales from last year has been steady for six weeks now. These trends had been gaining ground but as rates jumped in May, home buyers slowed just a bit so the sales rate isn’t gaining ground anymore. Home sales slowed in July and dramatically in September of 2022, so hopefully the data will show some transaction volume improvements in the second half of this year. There were 66,000 newly pending sales this week. That rate continues to be below the rate from 2022. Last year’s market turned dramatically after the July 4th holiday. It’s the holiday week now and next week’s report will have a big dip in activity. In this chart, the height of each bar represents the total number of homes in contract in a given week. The light portion of each bar represents those newly in contract. Watch this chart in the coming weeks to see how quickly home sales volume declines in the second half of 2023.
At this point, people are mostly adjusted to higher mortgage rates. There are buyers at these home prices and these mortgage rates, but they are still sensitive to big changes in the rates. So if mortgage rates surge to 7.5% — as they did in September — then we’ll have a dramatically slower autumn again this year. This recovery could very easily see another downturn.
Price
You can see this housing demand sensitivity in the price reduction data too. For most of this year, the price reduction curve tells the story of market recovery. Demand has exceeded the available supply of homes so fewer home sellers needed to take a price cut. Price cuts always accelerate in the second half of the year. In 2022, that’s the light red line in the chart, the percentage of homes on the market with price cuts skyrocketed each week. This year, 32.3% of the homes on the market which have taken a price reduction. The slope of the dark red curve shows a much more balanced market. It also shows us that the homes that sell in July and August already have price support.
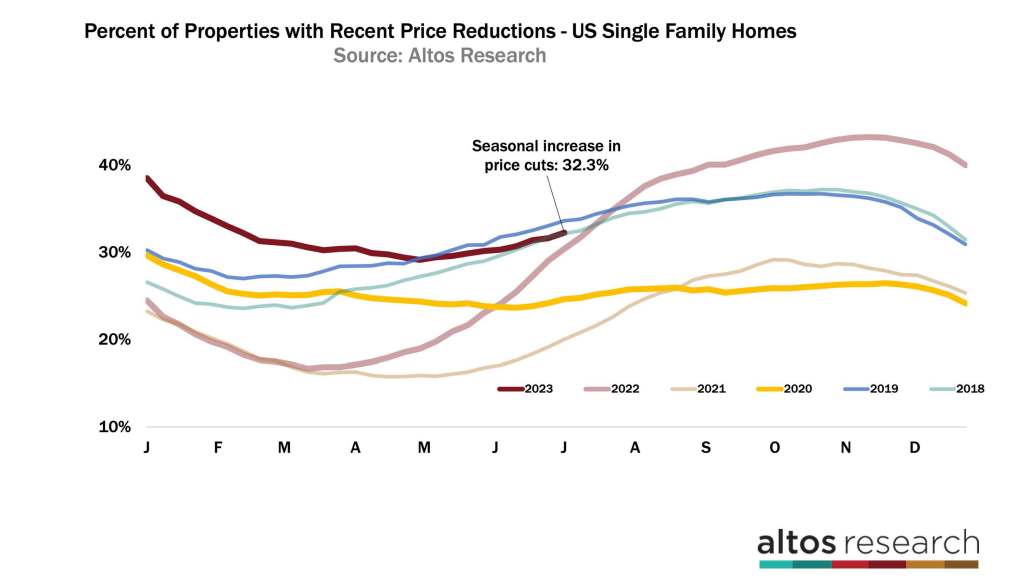
In a couple weeks the market will have fewer price reductions than it did in 2022. Certainly, the pace of cuts last year was so dramatic and this year is obviously more stable. The data showed a steep reduction in demand happening in 2022 at this time. But it was 3-6 months before the sales prices actually turned negative. The recovery of home buyer demand started in Q1 this year and is now impacting home sale prices. In September of 2022, price reductions spiked unusually as mortgage rates spiked. That could happen again if rates jump now. Keep your eyes on this chart each week.
The median price of single-family homes in the U.S. is $455,000 again this week. That’s been unchanged for several weeks. It’s a fraction below 2022 at this time. As I mentioned, June 30 is the peak time for home prices, and last year prices started their quick downtrend at this time.
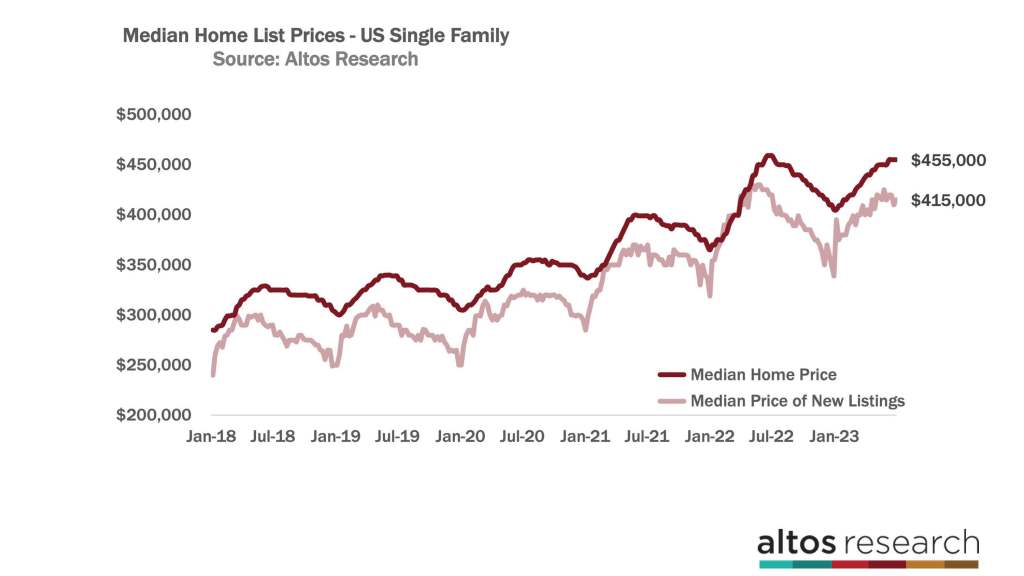
The light red line here is the median price of the new listings each week, and the week of the July 4th holiday always has a discount on the new listings. In 2022, it was a big dip. So by next week, there could be home price increases over last year. The median price of the new listings is $415,000 compared to $419,000 in 2022. The light red line is a lot more noisy. It bounces around. It will take multiple weeks to confirm the trend. But the fact remains that the second half of last year corrected down very quickly, so the year-over-year comparisons get much easier from here on out.
As the home price indicators grow more positive, they’re not really growing, it’s just that the headlines will no longer report home prices are falling. They’re not falling. Home prices fell in July and September last year. Home prices are pretty stable now.
There are four Altos home price measures to pay attention to:
- The price of the new listings each week — the light red line.
- The price of the total active market each week — the dark red line.
- The price of those newly under contract, or as we say, the pending sales.
- And, the price of all the homes in the contract pending stage.
Of those four data sets, the price of the new pending sales has been positive year over year for four weeks now. This is the cohort of homes that take offers and go into contract. And they’re going into contract at higher prices than they did a year ago. After a month of the new pending sales turning positive, the median price of all the pending sales is now positive compared to 2022 for the first time.
The chart below shows the price of the new pending sales. This week, the median price of the homes that went into contract is $380,000. That’s down 1% from last week but 1.5% higher than in 2022. The dark red line is now consistently above last year. The annual comparison will get another boost in September.
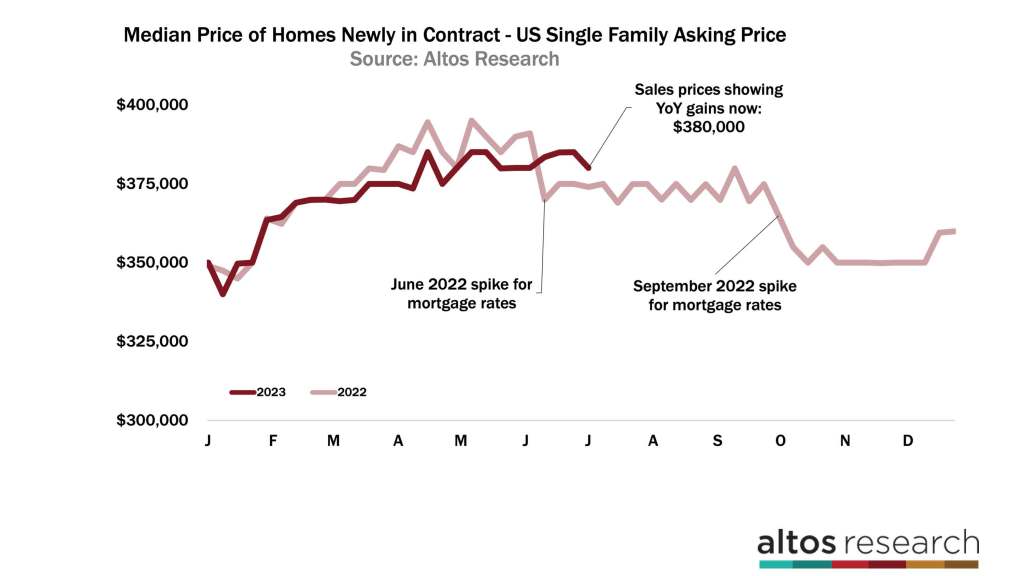
That big dip in sales prices in September 2022 teaches us how sensitive home buyers are to the change in mortgage rates. So I’ve been pretty optimistic in this week’s report, but know that the market sentiment can stop abruptly if rates jump again. The economic news has been strong enough and inflation persistent enough that higher rates from here seem like a real possibility. Though as I always caution, I do not predict mortgage rates. I really have no idea where they go from here. We just report how the housing market is acting at the time.
More next week.
Mike Simonsen is the president and founder of Altos Research
