


I saw a New York Times headline this week that implied the market was slow because “sellers are unwilling to lower their price.”
The implication of that headline is that if sellers dropped prices, then we would have more home sales. But that’s not true. There are more buyers than sellers. Buyers are buying homes at these prices. This is a supply-constrained market. Homeowners are simply unwilling to sell.
We have more demand than supply at these prices. We know this from a number of different metrics. Currently, the data shows the fewest price reductions since last June. Fewer sellers need to cut their prices each week because buyers are buying. The homes that are on the market now are not declining in price.
Our immediate sales metric also confirms this. Of the 73,000 new listings this week, 25% of those are already in contract. Sellers lowering prices does not help more deals get done. There is too much demand for the current supply. If you ask buyers, of course, they’d like lower prices. We would have more buyers if prices or mortgage rates were lower, but buyers are not the constraint on the market right now. We’ll see how this plays out in all the stats this week.
When demand for homes is robust, fewer sellers need to cut their prices
That’s exactly what’s happening right now. The percentage of listings with a price cut fell this week, to below 30%, for the first time since June 2022. You can see the striking difference in the curve from last year to this year in the chart below. By April 2022, price reductions were climbing quickly each week. Demand was weakening at that time. Follow that light red line starting to curve up in the chart. By June 2022, we’d crossed over 30% of the market. This year — the dark red line — price cuts have been ticking down rather unexpectedly. Each week the market recovers a bit from the ice-cold end of last year. That is clear in the price reductions.
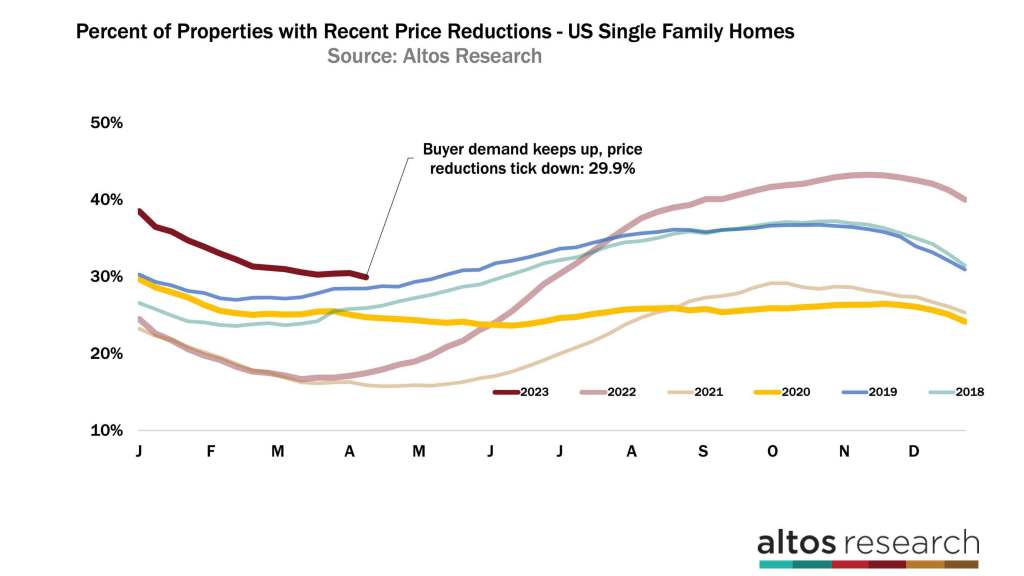
This price reductions metric tells us two things:
- Home sales prices for sales that will close in the future are not under pressure. While you’ll hear headlines about falling home prices for several more months, those are sales that were completed after the peak price reductions a few months ago. But homes in contract now are not under the same pressure as those sales from before.
- The market for the moment is in a warming trend. Despite the internet chatter about a coming recession, as of right now Americans are buying the homes that are available. The market is accelerating, it’s not decelerating.
Inventory
I suspect that we’re about to finally get some new inventory. Inventory isn’t climbing yet, but soon I think it will. This week’s available inventory of unsold single-family homes was essentially unchanged from last week at only 410,000. In my neighborhood, I’m noticing a few listings finally starting to pop up for spring. I anticipate we’ll have an uptick in the available listings by next week. In most years, inventory has been climbing for weeks or months already by this point.
Last year’s inventory had bottomed in early March. In 2022, there were only 261,000 homes on the market. The gap between 2023 and 2022 is closing. If this trend continues you can imagine that later in the year we could end up back in the pattern of decreasing inventory each year. Wouldn’t that be a surprise?
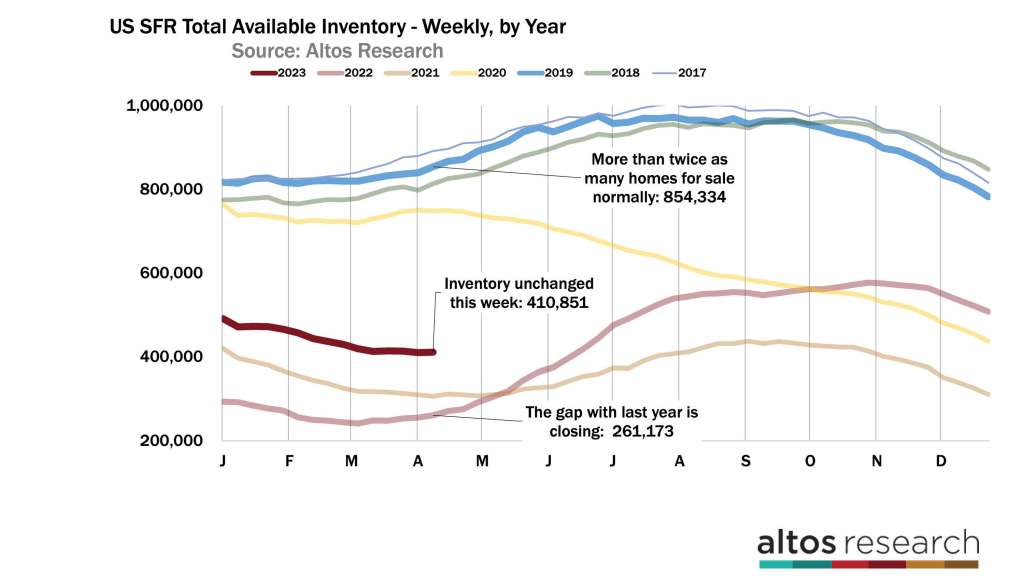
Available inventory is a function of fewer sellers. People who own their homes at very low costs may want to hold on to that first home because it’s so cheap. Inventory is also a function of plenty of buyers. That supply/demand pattern is what we see in the chart below. This represents the new listings each week.
Each bar counts the total number of new sellers each week. The taller the bar, the more sellers. It’s striking how many fewer new listings there are each week compared to previous years. The light portion of the bar represents those new listings that went into contract essentially immediately. That portion of the bar is growing.
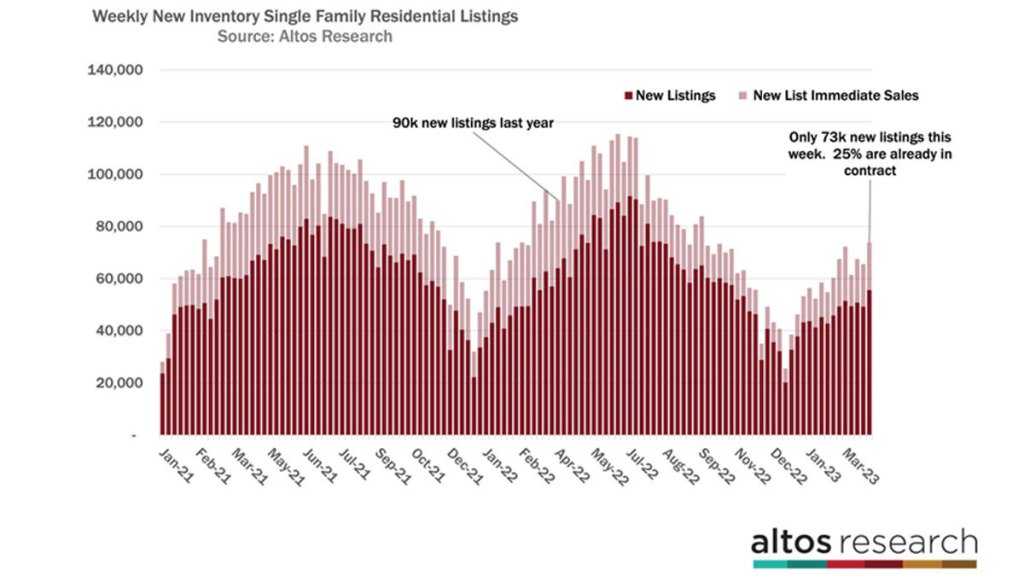
Now, I don’t want to overstate this: there’s not a ton of buying demand, but there is enough. There were 73,000 new listings last week — that’s 18% fewer than in 2022. Each week there are roughly 20% fewer homes coming to market compared to last year. Supply remains constrained. Of those total new listings, 25% of them went into contract within hours of listing or just a few days. This is dramatically fewer sellers than you’d hope for in a strong housing market. 25% immediate sales is a lot fewer than last year when demand was still hitting record highs.
It would be a mistake to imply that we have a hot housing market. As I’ve been saying, there are plenty of buyers for the available inventory. The homes that are of good quality and priced right are moving quickly. This is a big change from last fall. So this is a market of few sellers but plenty of buyers. As I mentioned at the start of the video, the low transaction volume is not a function of price. Lower prices don’t equate to more sales. The market is supply-constrained.
Price
The median price of single-family homes in the U.S. right now is $439,900. That’s up a tiny fraction from last week. There is no downward pressure on prices, but the comparison from 2022 continues to get worse. Home prices are ticking up, but each week tighter relative to last year.
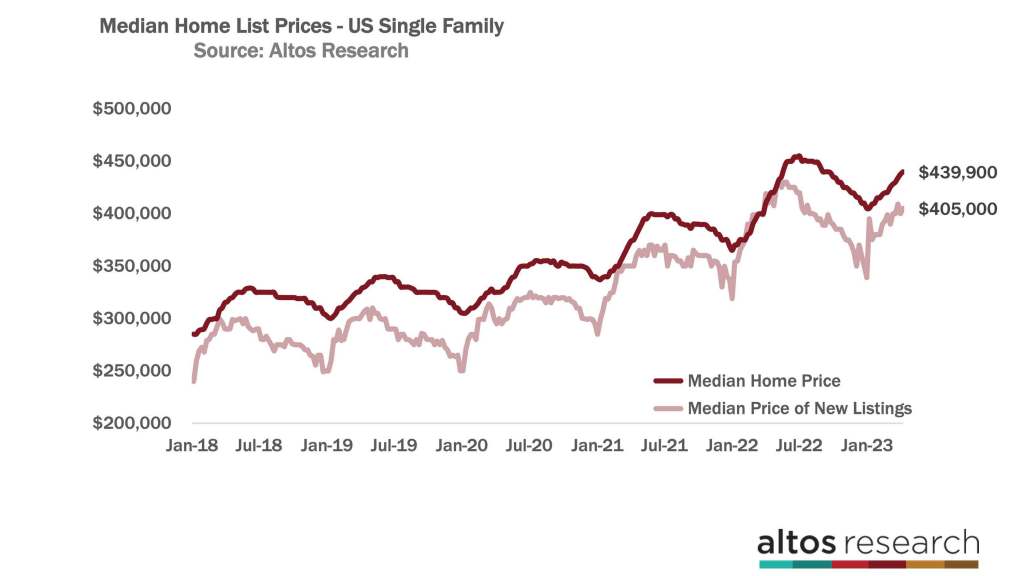
The price of the new listings each week is below 2022 data at this time. That’s the light red line in the chart. At $405,000, the new listings are priced lower than in 2022 and 6% lower than the peak at the end of May last year. The end of May is always when the new listings prices peak, so there are six more weeks of slowly ticking up prices. It shows us how home prices will be flat to slightly down for the full year of 2023.
This data is how we know that the sales prices are going to continue to report negative year-over-year price changes for several more months. Homes get listed now, they take offers in May, they close in June or July and the headlines appear in August. We’re going to keep hearing these headlines, and it’s going to sound very bearish. The actual real-time data is likely much more stable than those headlines will sound.
The median price of the pending sales is $375,000. That number is unchanged from last week and 1.3% below last year at this time. In the chart below, the dark red line is the curve from this year, and the light red line is the trend from 2022.
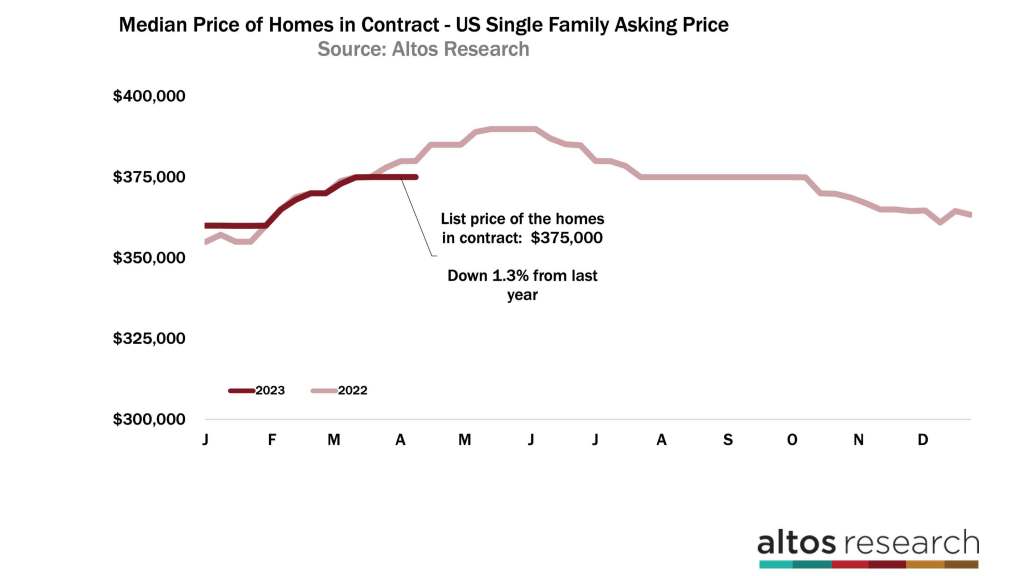
Each week for the next few months, the comparison to last year will likely keep getting worse. These are the pending sales — the homes that are in contract now. What we know about the pending sales price is that it’s very close to the final sales price in aggregate.
For example, if you look at the Altos pending sales price from back in February, it was in the $364,000 range. When NAR reported the closed sales price for February, it came in at $363,000. You can use the Altos pending number as the earliest proxy for the actual sales price of homes that will get reported in several months.
Mike Simonsen is founder and president of Altos Research.
