


After the crazy housing market of 2020-2021, you would think we would get a break in 2022, but that isn’t the case. Now that we are in June, it’s time to look at the year in housing and what has been good, bad, and just crazy so we can make sense of all the data. With mortgage rates surging over the last week, I will try to outline what it all means because my theme is straightforward: the housing market is savagely unhealthy.
The good: housing inventory
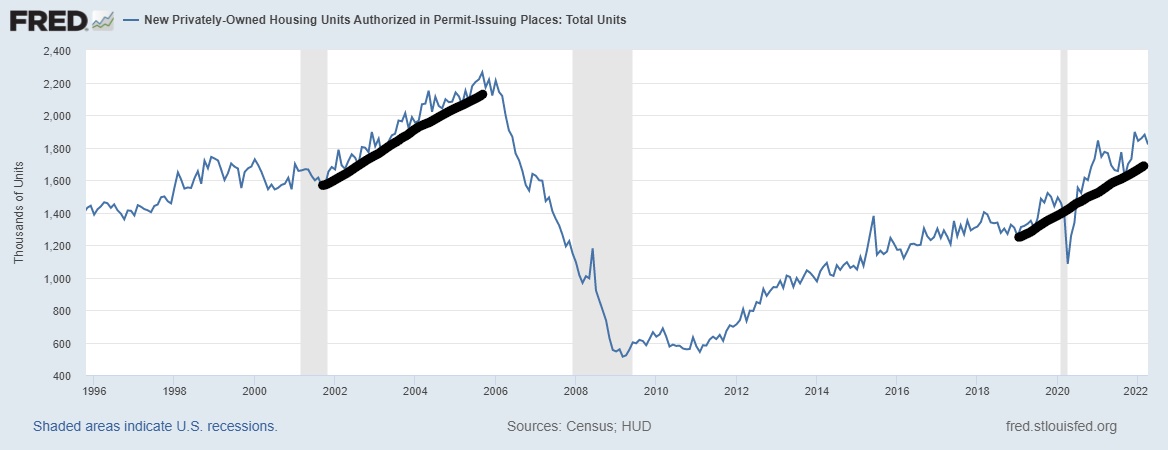
For the first part of the year, housing permits and starts were doing fine, which was not only good for the housing market but the overall economy. Construction jobs and big-ticket purchases are all positive for the economy.
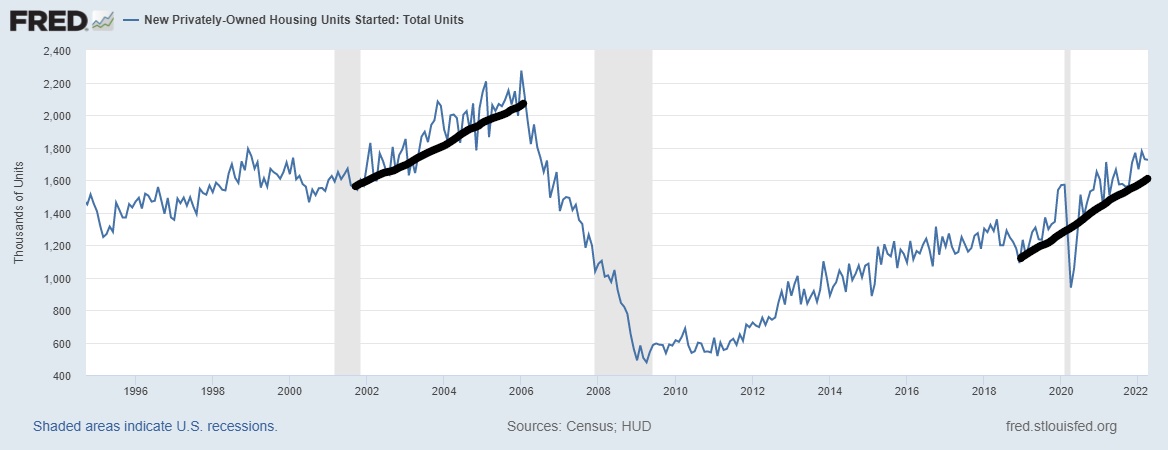
When the economy is expanding, housing permits grow. However, on a historical basis, when housing permits are in decline, that is when people start talking about a recession. For the first half of 2022, housing permits were a plus for America.
The bad: housing completions
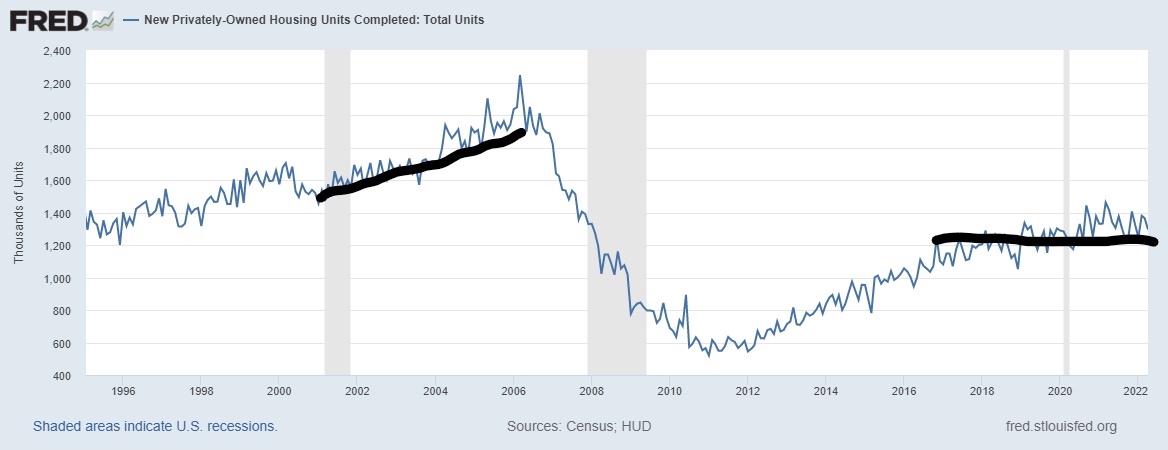
Even though housing permit data looked solid, housing completion has been a disaster; we haven’t been able to finish homes promptly for years. Over the last several months, mortgage rates rose even as construction timelines increased, causing cancellations of homes under contract.
The crazy: ghost supply
In May, the Census Bureau reported a monthly supply spike in new home sales data, which at face value would seem to suggest there are a lot more new homes for sale. Unfortunately, when you break down the data, you can see that out of the six months of supply; many of those homes are ghost supply! What is ghost supply, you ask? These are homes that are counted as supply but haven’t even started construction yet.
As crazy as it sounds, that is our reality today. Out of the six months of supply, only 2.2 months of that supply is under construction, and only 0.8 months of supply are homes that are actually completed. 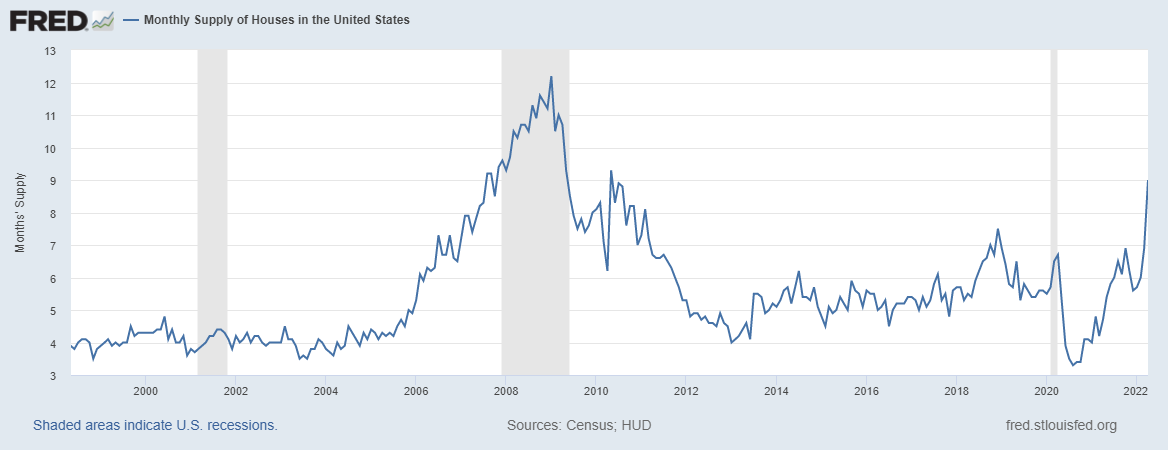
The good: homeowners’ credit profiles
We went from nearly 5 million loans in COVID-related forbearance to under 500,000 currently: This is one of the greatest success stories ever. COVID-19 was a health crisis, not an economic crisis, so all these homeowners were doing fine before COVID-19. As time went on, they got off forbearance and their families stayed in their homes. The forbearance crash bros of 2020 and 2021, meanwhile, failed spectacularly. 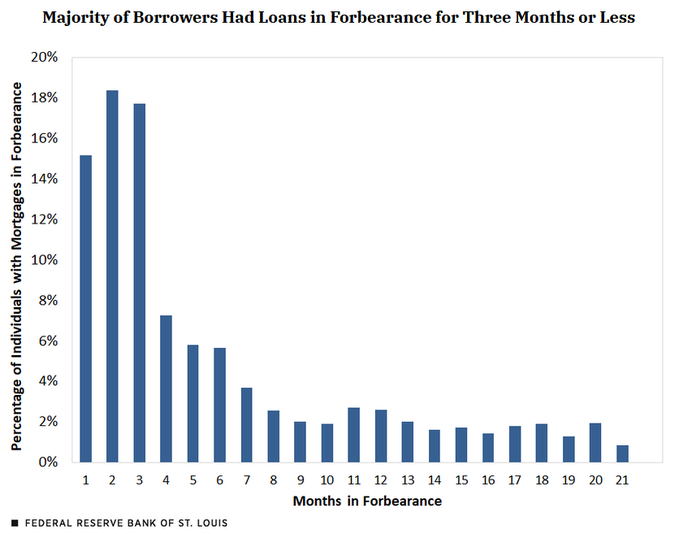
Credit profiles look excellent as cash flow data from homeowners look great. The benefit of homeownership is that it’s a fixed cost, and as wages rise, homeowners’ cash gets better with time. Since we just had a mega wave of refinancing done in the last two years, American households that own homes are doing well.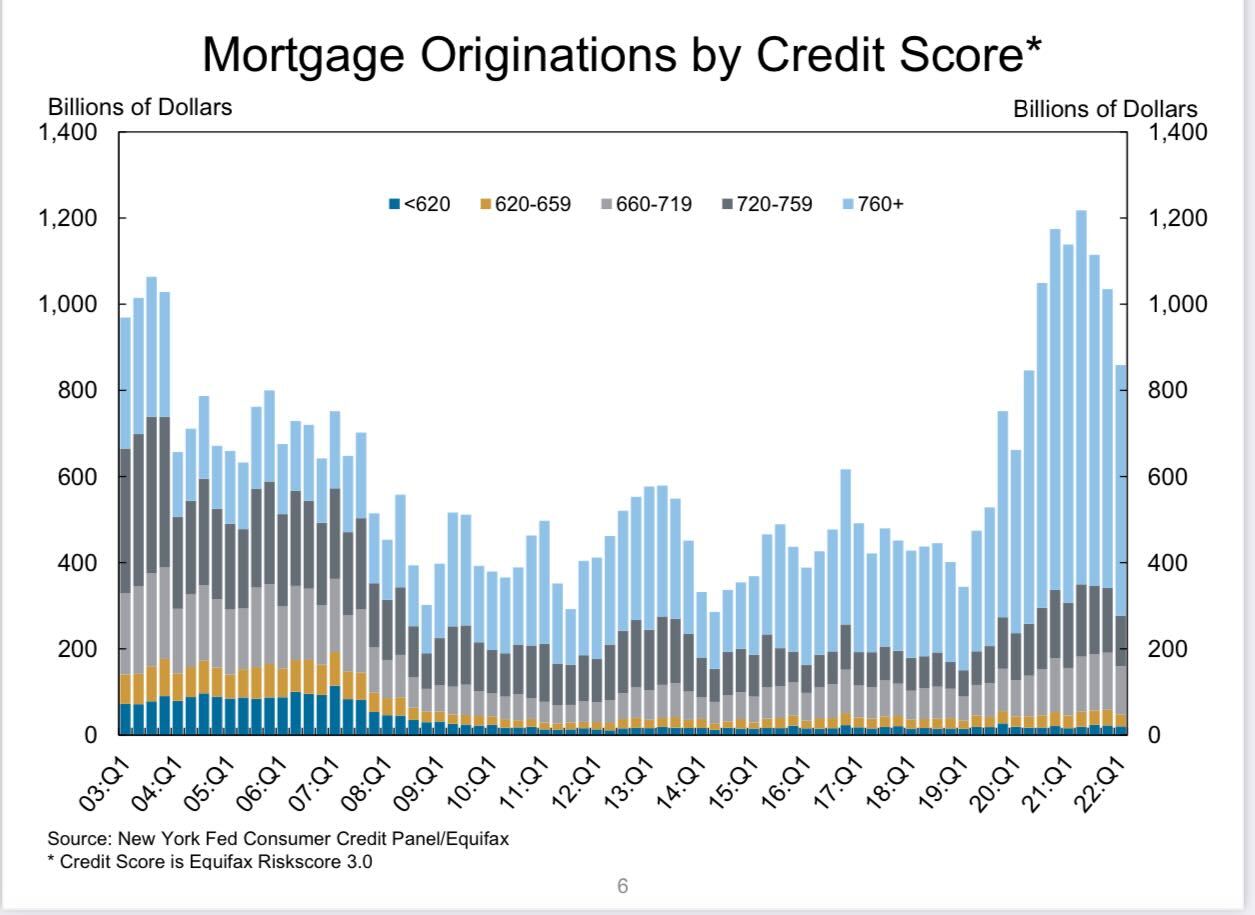
The bad: skyrocketing home prices
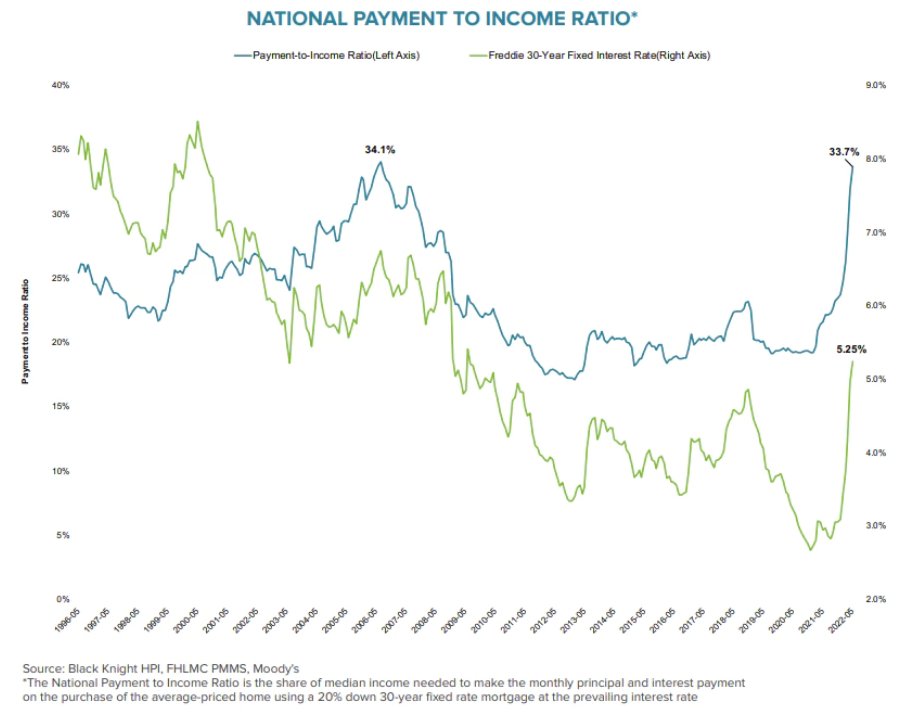
While homeowners are doing well, buying a home in America has become more expensive. Home prices have exploded since 2020 and the recent rapid surge in rates have increased the total payment needed to buy a home.
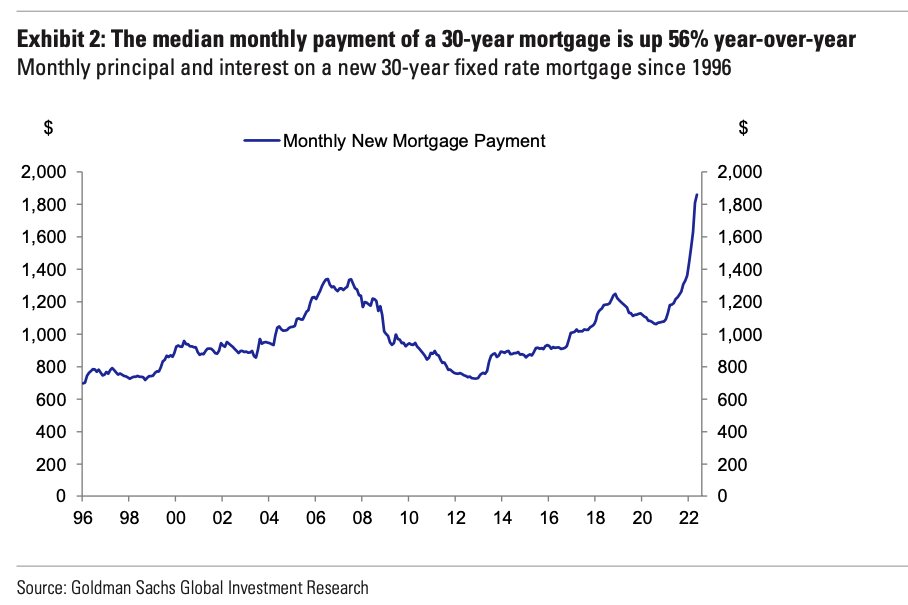
The crazy: housing inflation
We went from an affordable housing payment story to a massive affordability hit. What happened to the U.S. housing market is historical: We went into a housing inflation nightmare.
What does it all mean?
My biggest fear for the housing market in the years 2020-2024 has been that we would get just a bump more in demand from our most enormous housing demographic group, the millennials.
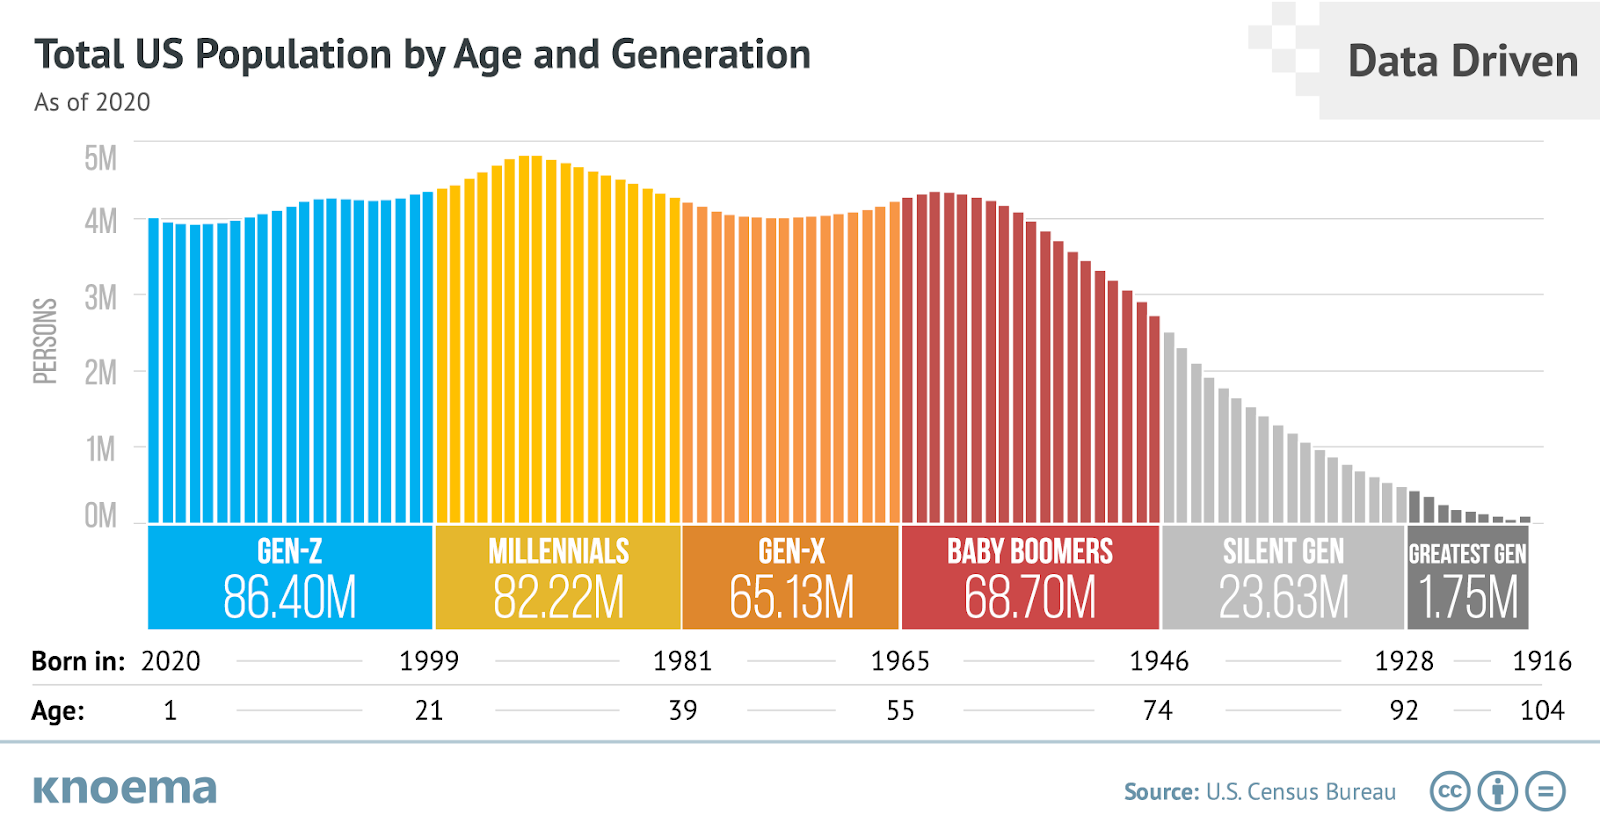
People ages 28-34 are the biggest demographic in America and their demand for housing has fueled unhealthy home-price growth. Combined with our first real inventory crisis in America, this has created forced bidding for homes. Take a look at the crazy data below; vertical price charts are never a good thing.
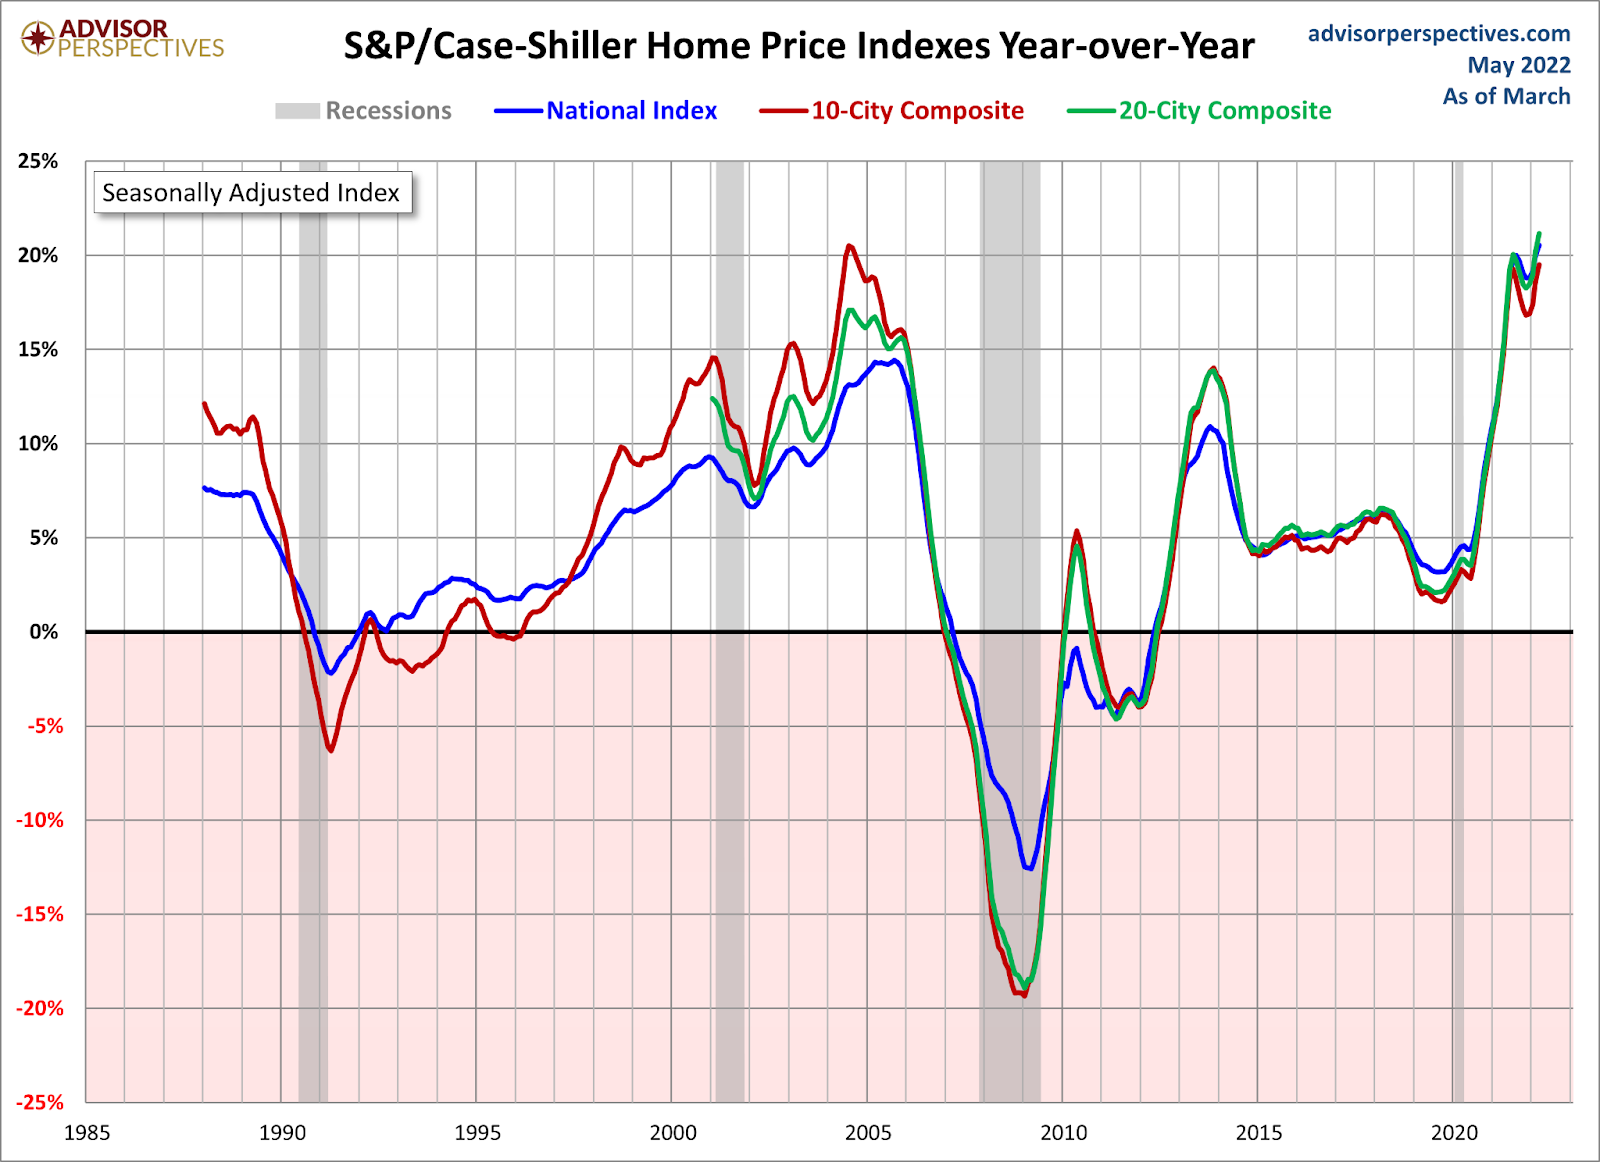
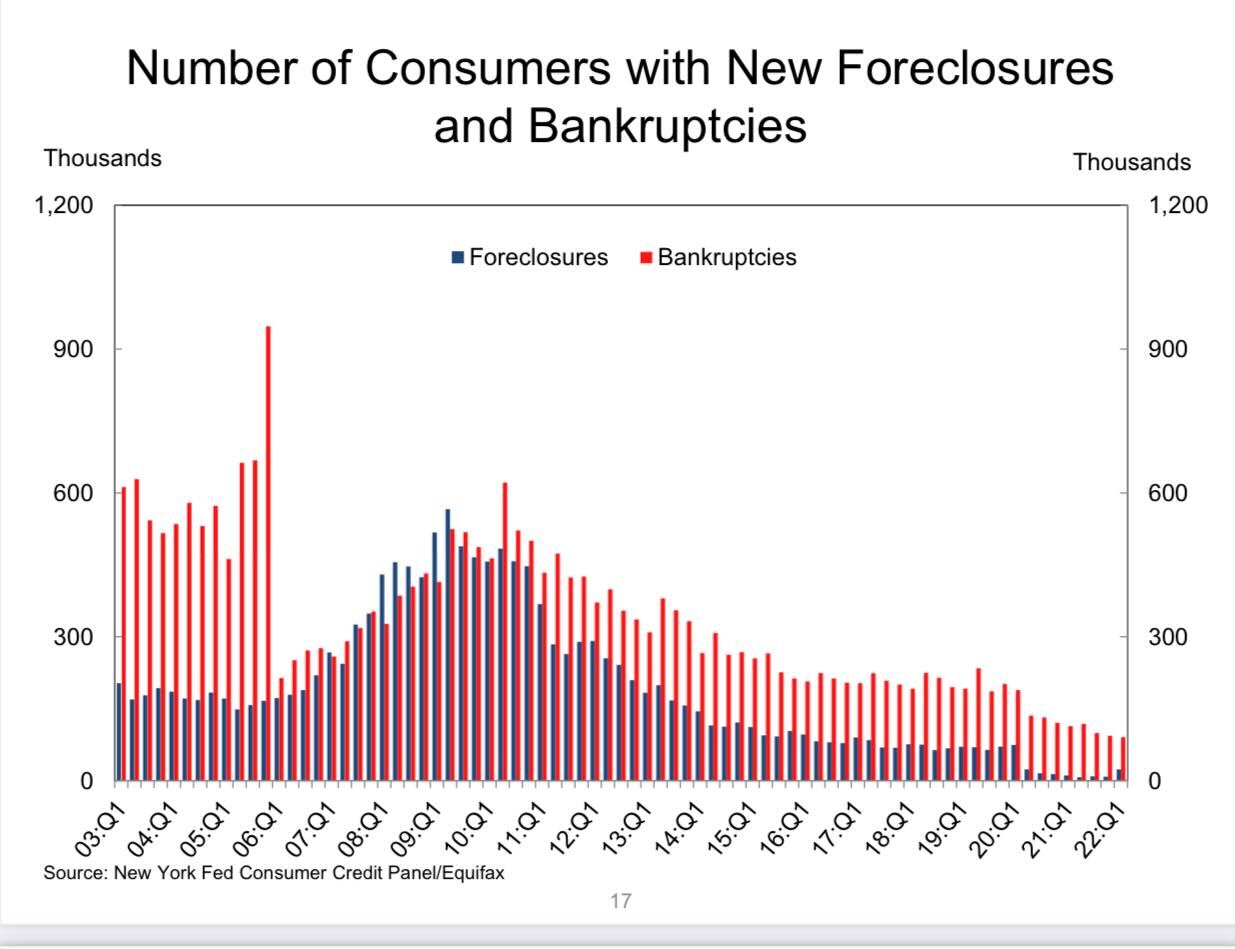
We didn’t have a massive credit crisis with foreclosures and price declines during a job loss recession. The opposite actually happened, as total Inventory data has been falling for years and got to such a low level under 1.52 million that it created unhealthy home-price growth.
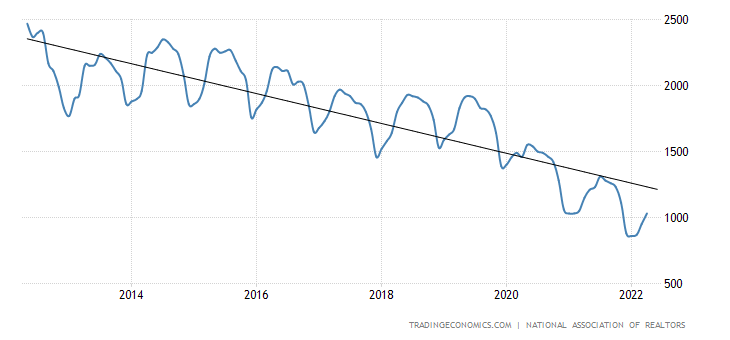
With unhealthy home-price growth, the risk is rising rates creating more damage to affordability. As we can see above, that’s what happened; purchase application data reflects this. I have believed since the summer of 2020 that if the 10-year yield could move above 1.94%, housing dynamics would change. With the price growth that has happened since then, it’s no shock that demand got hit.
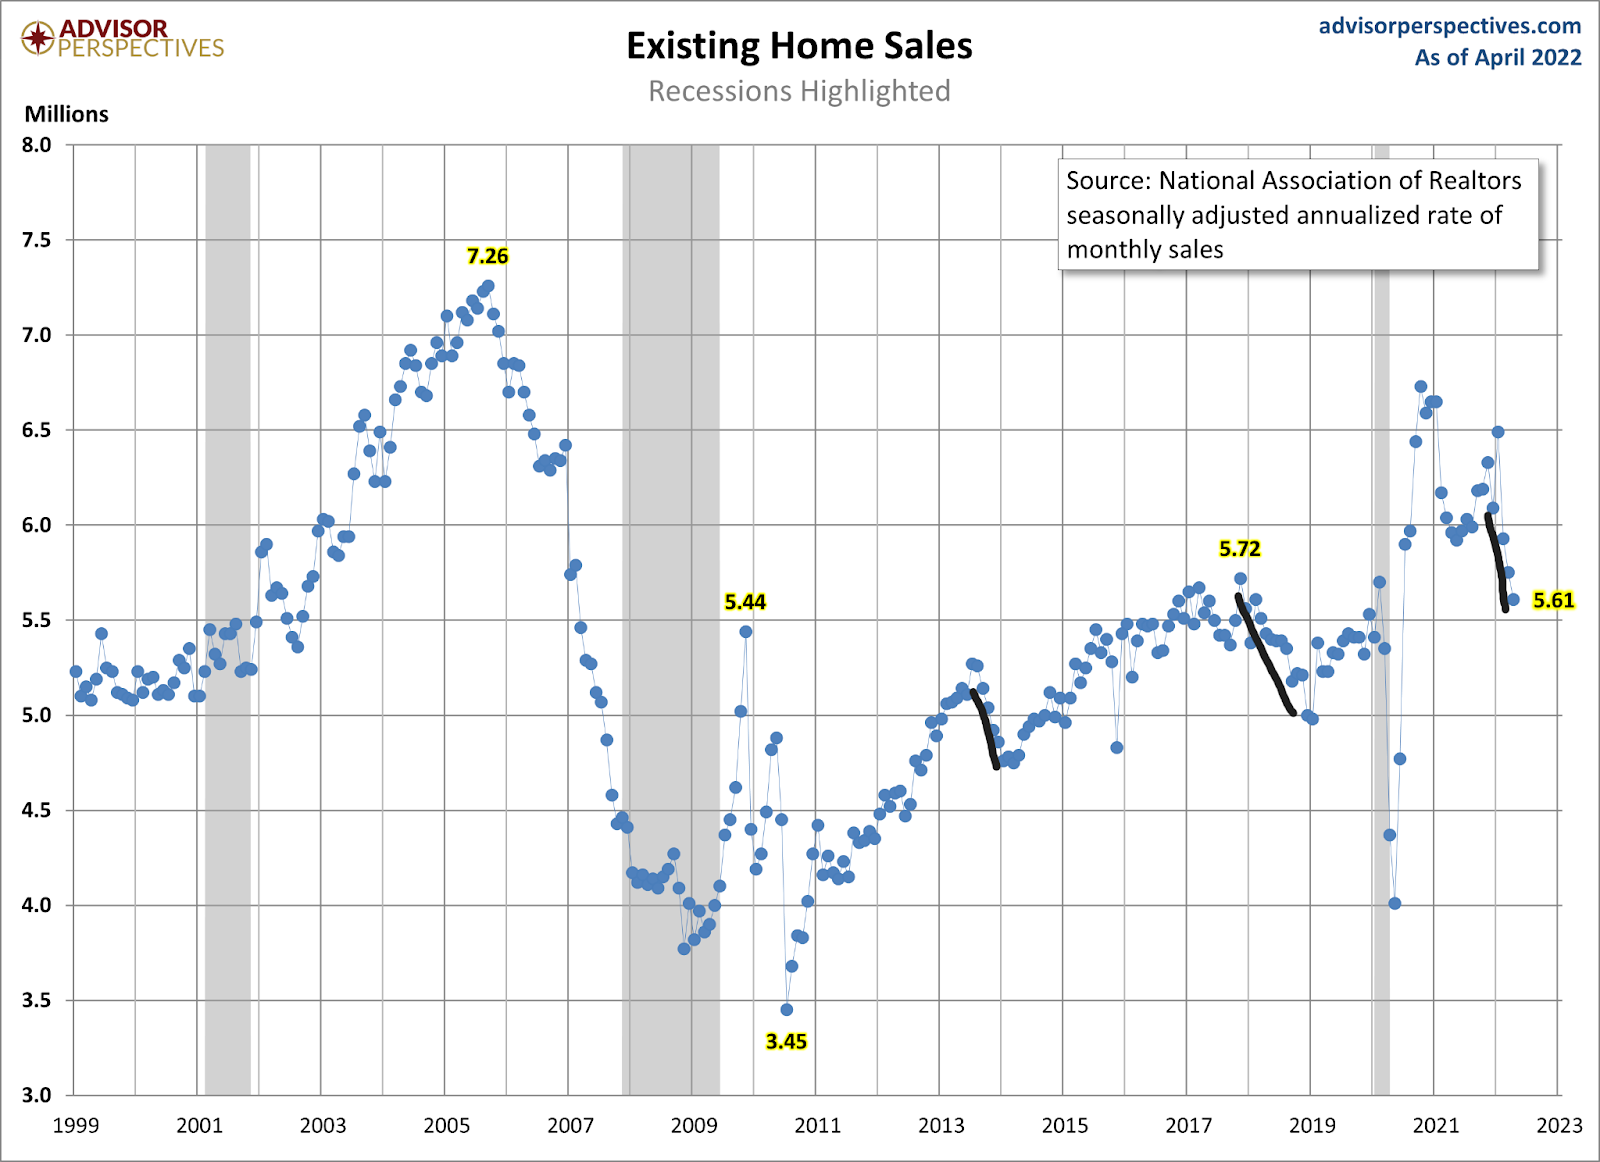
Purchase application data is down on a four-week moving average by 16.75% yearly. The levels are near COVID-19 lows but back to 2009 levels. Home sales are higher than in 2009, and this data line is a trend. You get the point in the chart that higher rates matter.
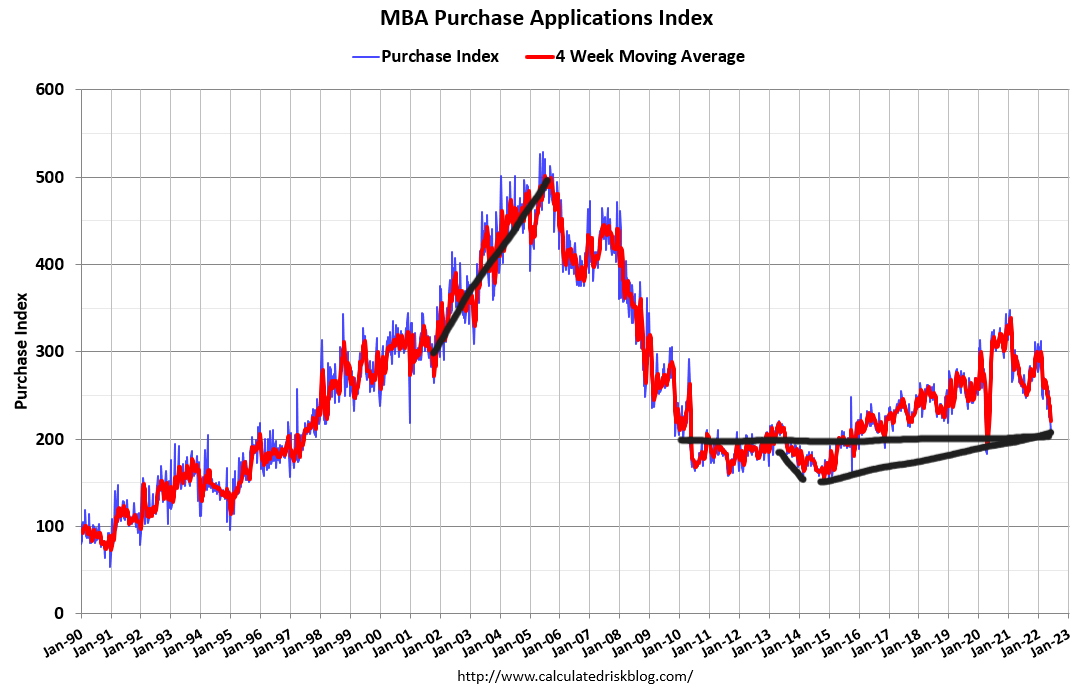
What this means is that home sales still have room to fall lower. Rising rates impact housing demand so sales can continue to fall as long as purchase application data is also falling on a year-over-year basis by double-digit percentages.
As we can see, it’s been a wild 2022 already; the massive home price gains from 2020 have left the housing market vulnerable to a payment shock that has impacted demand more than it would have if home prices grew less than 4.6% a year during 2020-2024. This is why I had a set goal of price growth during this period: if home prices grew over 23% during these five years, it would be a major red flag.
The crazy part of this story is that home prices broke that model in just two years. While homeowners’ credit data looks great and homeowners are living well with their positive cash flow, we have issues with affordability and it’s taking forever to build homes. Add rapidly rising rates and it’s a recipe for
Still, you would rather have these problems than what we had to deal with after the housing bubble crashed. Jobs were lost, families were being foreclosed on and the unemployment rate was rising while many households were stressed. Seen in this context, the current volatility looks like first-world problems.
