


Is the debt ceiling mess in Congress the one thing that will derail the housing market this year? Until now, we knew that even at these relatively high mortgage rates, there are more buyers than sellers. While home prices are lower than they were in 2022, they have not been falling. Buyers are basically buying everything available this spring.
Mortgage rates have also been slowly rising, approaching 7% again. And some of that is driven by the debt ceiling uncertainty in Congress. The potential U.S. government default adds significant risk to mortgage rates as well as the economy in general. Fingers crossed that we get past this moment without too much damage. There is a risk that it could derail the surprisingly strong housing market so far this year.
Price
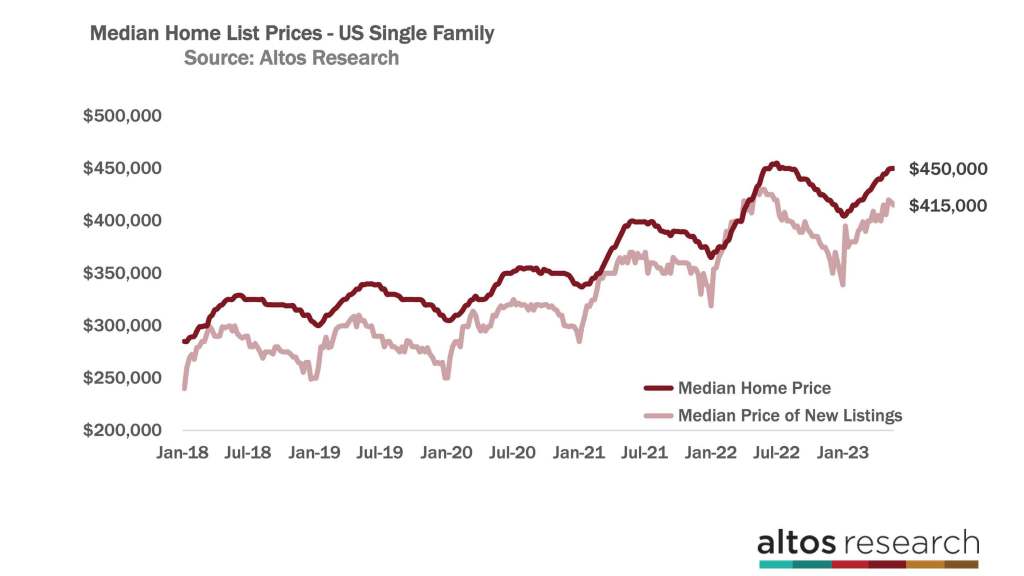
The median price of single-family homes in the U.S. this week is $450,000 which is basically unchanged from last week. It is the same as it was in 2022 at this time. In 2022, there was still momentum in the market from the tail end of the frenzy. Some prices were at an all-time high until the end of the second quarter.
The median price of the newly listed homes is 3.5% below the homes that were listed in 2022 at this time. At $415,000 that’s down seven-tenths of a percent from last week. It’s not uncommon for new listings price to peak in early May and this year, the price of the new listings peaked the first week of May. In 2022, the new listing prices peak at the end of May. It was July when the data showed the new listings prices falling rapidly each week. In the light red line below you can see the big steps down in July 2022. Those were much steeper price adjustments than the data typically shows in July. Here at Altos, we’ll see what this year brings.
If there is a debt ceiling crisis and mortgage rates spike, it’ll take a little time to show up in home prices. During the initial COVID-19 pandemic lockdowns, it took about three weeks for prices to adjust. By mid-May 2022 it was clear that home buyer demand was accelerating, so prices rebounded. The COVID-19 pandemic lockdowns created about five weeks of opportunities for opportunistic home buyers.
Inventory
There are now 424,000 single-family homes on the market across the U.S. That’s up nine-tenths of a percent from last week. Available inventory from home sellers continues to follow the path it has all year. There is restricted supply and there are more buyers than sellers.
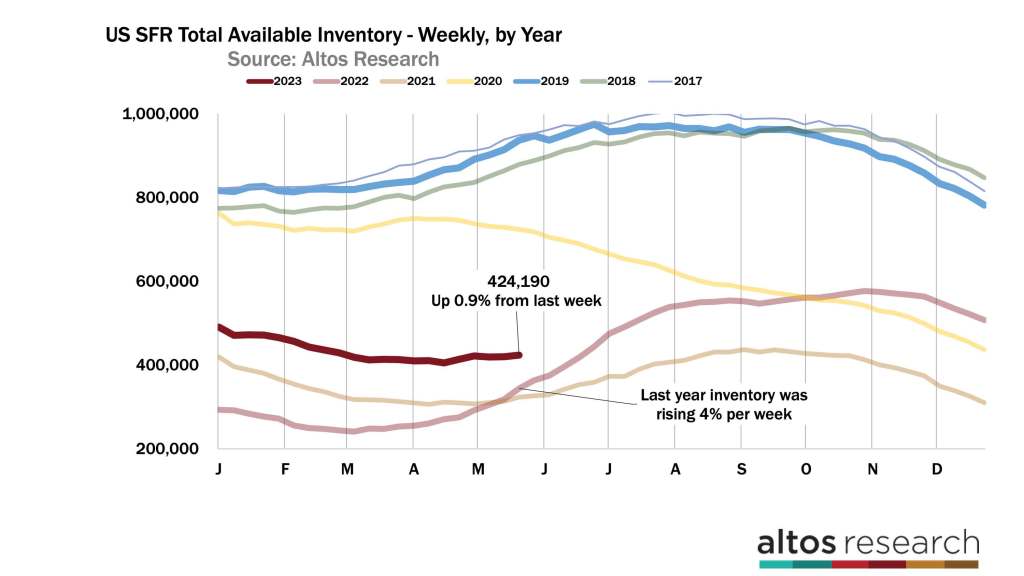
We started the year with 75% more homes on the market than in 2022. Inventory increased last year as buyers slowed, but there were never many sellers. This year, the buyers resumed and they’ve gobbled up the available inventory. Most years by mid-May the available inventory has grown by 15-20% from the start of the year. In 2023, available inventory shrunk by 14%. At what point do you call this a hot housing market? This market is crazy, and it continues to surprise us.
It’s been a hot real estate market this spring. It’s so hard to utter these words given the year we’ve had and the economic signals all around us. When the debt ceiling shocks the market, it may not result in more inventory. If sellers are scared, then they don’t sell. Some sellers will withdraw and leave the market. There was no jump in inventory at the initial COVID-19 pandemic lockdowns. Both buyers and sellers slowed for those first few weeks. So we’ll watch those new listings numbers very closely over the next few weeks. Listing volume has been so low this year, it would surprise me if economic uncertainty suddenly changed the minds of homeowners.
We will see the impact of the debt ceiling crisis very quickly in the pace of home sales each week. Home sales — as measured by the pending sales — has been steadily climbing this year, bouncing off 2022’s dramatic decline. With 398,000 single-family homes in contract, that’s only 14% fewer than in 2022 at this time. In December and January, the pending count was 30-35% fewer than in 2022. A debt ceiling showdown, with dire consequences, will delay offers from being made. It could also delay deals already in contract from closing.
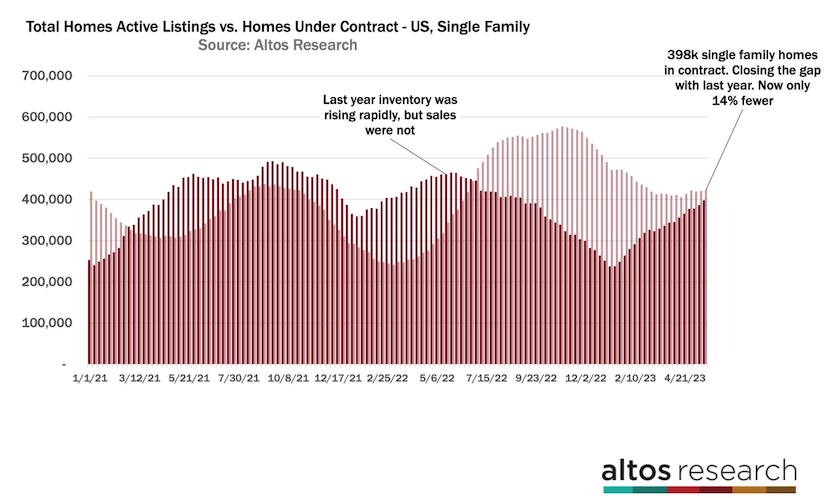
I like this view of unsold inventory plotted next to the sold inventory. In 2022, inventory was rising quickly, but the sales were not. There were still more homes in contract than available on the market. The light color bars represent the inventory count each week. The dark bars represent the pending sales. The pending sales are now rising while inventory is not. With only 398,000 single-family homes in contract, there are still fewer home sales than usual for this time of year. The seasonally adjusted home sales numbers will still report very low for May. Each week we’re recovering a bit more, though.
If Congress manages to avoid a crisis with the debt ceiling, by July we might be running ahead of the sales pace for the second half of last year. We’ll keep a watch on the pending sales rate each week until the debt ceiling mess is resolved.
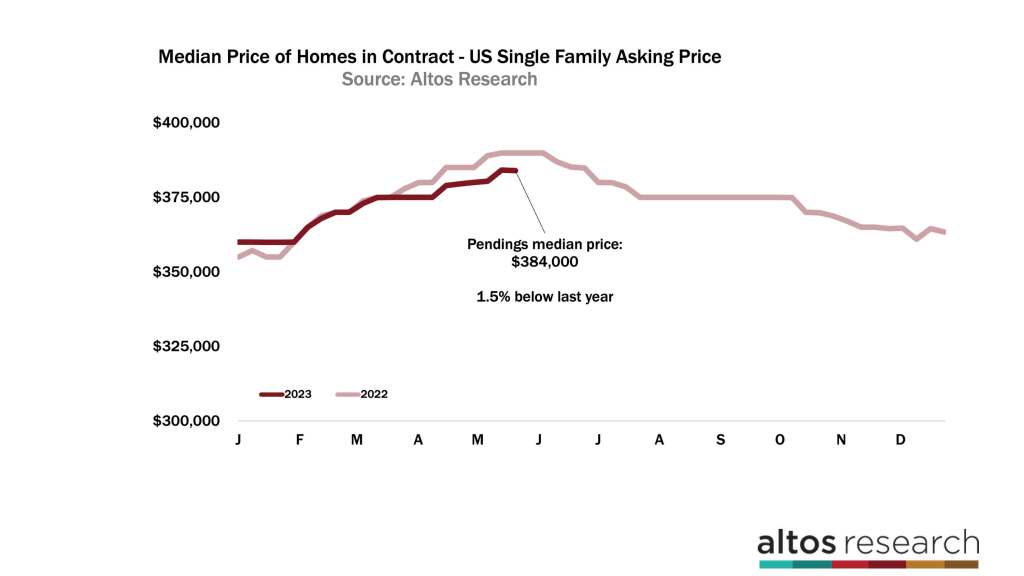
We keep track of the price of those pending sales also. The median price of the homes in contract was basically unchanged this week at $384,000. That’s 1.5% below 2022 at this time. If we don’t have these external shocks, we could finish 2023 with home prices on par or fractionally higher than at the end of 2022. This is the median price of all the single-family homes in contract. These are sales that will complete in June and July. Prices are currently running below 2022’s data, but that momentum is changing. Prices lurched lower in July and October. Remember that sales prices are the most lagging, backward-looking indicator in all this data. This will be true if mortgage rates spike or credit availability craters due to a default or some other government uncertainty.
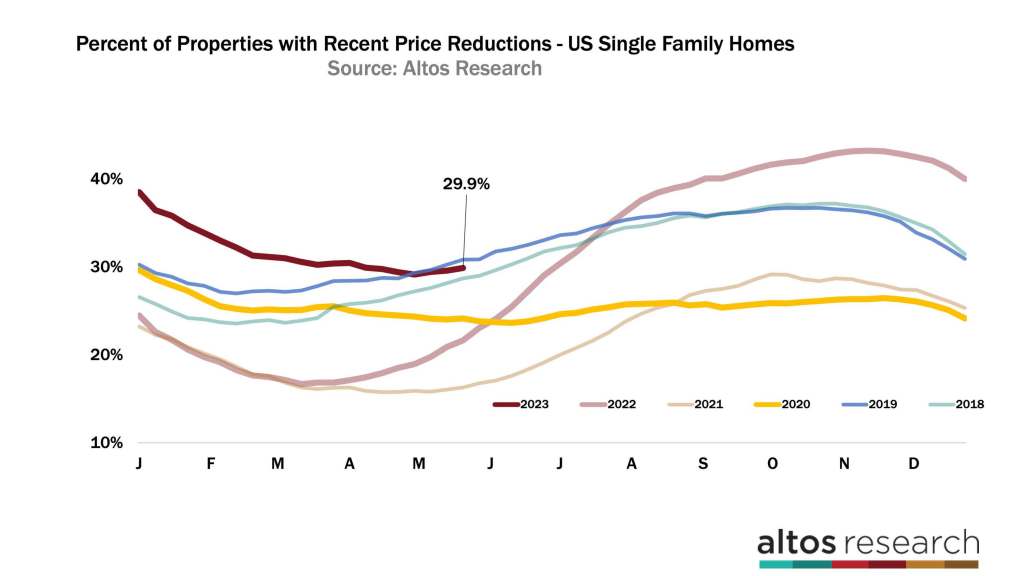
Price reductions ticked up as you’d expect for May. 29.9% of the homes on the market have taken a price cut. So far this year, the housing market has been hot enough and homes moving fast enough that there have been fewer price cuts. The dark red line represents this year’s curve and it’s only now starting to rise. When homes get listed in April and May and they don’t have offers yet and they need to cut their prices to get moving. Price cuts accelerate in the second and third quarters, and peak in the fourth before resetting for the end of the year.
With an acute crisis, as we had in 2020, price cuts don’t spike immediately. Sellers wait a few weeks to see what will happen. During the COVID-19 pandemic lockdowns, I expected price cuts to start rising. When they didn’t, it was an early signal of market strength. In April and May 2020, we were all assuming that the real estate market would crater and we’d see panic quickly. Many people held those assumptions for way too long. One place we could see the surprising strength was in the price reduction data. Keep your eyes here if the government throws us into a new crisis this spring.
More next week.
