Well, friends, Americans are buying houses this winter. Each week housing inventory is falling, and the pending sales are climbing. The market has fewer price reductions and more immediate sales each week. The market is not crazy hot like last year, but the data is irrefutable. I’ve been calling the trend “surprising,” but I’m no longer surprised because it has been so consistent.
I suppose the big question is not whether or not people are buying homes, they are. It’s whether or not this soft landing will last. Will a recession hit hard and derail the year’s demand? Or will a strong economy lead to higher mortgage rates and a repeat of the ice-cold conditions of the second half of 2022? Either way, it is obvious that the demand for homes is plenty strong.
Inventory declined
Available inventory of single-family homes on the market declined by another 1.8% this week to 457,000. It’s not totally unheard of for inventory to creep down for a few weeks in the early part of the year. This year’s change is notable only because inventory was rising unusually fast in September and October.
If you read the headlines, or if you watch the real estate crash YouTubers, then you’d be expecting inventory to climb dramatically each week. It’s simply not happening. Inventory across the country is declining because we have more buyers than sellers. We have very few sellers. This trend doesn’t seem poised to change direction either. So if mortgage rates stay in the low 6% range, we can expect inventory to decline each week through February.
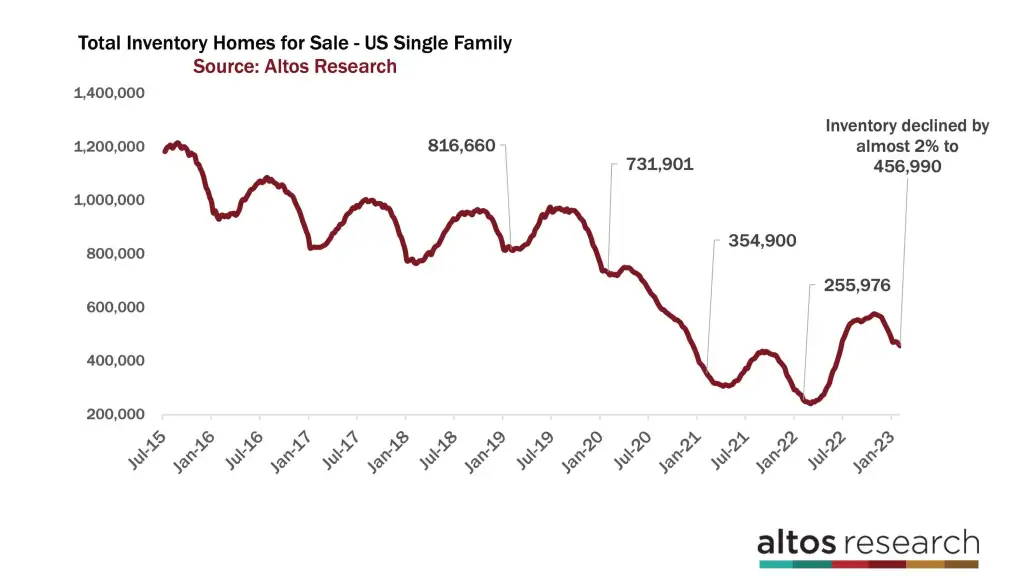
Based on this chart, in each of the last two years, inventory kept declining with insatiable demand through February and March. I’ve highlighted February 2021’s 354,000 homes on the market. This point was still eight weeks before the bottom of the inventory curve. On the other hand, I’ve highlighted February 2019’s 816,000 homes on the market. Inventory was already at its low point for that year.
You can see the curve had already bottomed out and was ready to start climbing for the spring home-buying season. 2021 and 2022 have been the exception, but it sure looks like 2023 will be more like the last two years than the pre-COVID-19 pandemic levels. This means inventory will keep declining for several more weeks.
This week, only 52,000 new listings came on the market. There were 58,000 new listings on the market at this time last year. Plus, immediate sales are back to 20% of the new listings. Meaning, of those 52,000 new homes on the market, 11,000 took offers and went into contract within days of listing. In this chart, each bar is a week and it measures the total count of new listings. The light portion of the bar signifies immediate sales specifically.
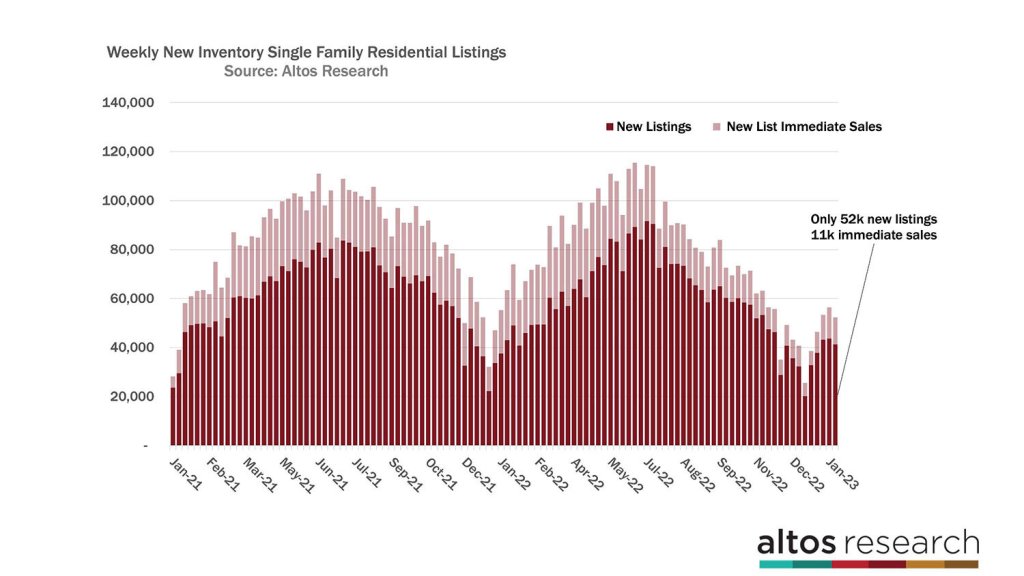
This data tells us a few things. Good properties that are priced well will sell quickly. That trend might seem surprising if you’re not in the market right now, but that is what’s happening. The data also tells us that there is no sign of any flood of homes for sale coming. There are no distressed sellers. There are no panicky investors. There are fewer move-up or move-down sellers.
As a result of these trends, inventory will remain restricted. When the supply side of the supply-demand curve stays tight, that helps keep a floor on pricing. Even though the affordability of mortgage payments is dramatically worse than it was in 2022, the demand at these prices is outweighing the supply.
On the demand side, we can see the volume of pending sales increased far above December numbers, and it is climbing rapidly. There are now 279,000 single-family homes in contract with the sale not yet closed. Each bar in the chart below represents a week with the total count of homes in the contract pending stage. The light portion of the bar represents those newly pending sales each week. See at the right end of the chart how quickly the count of pending sales is rising.
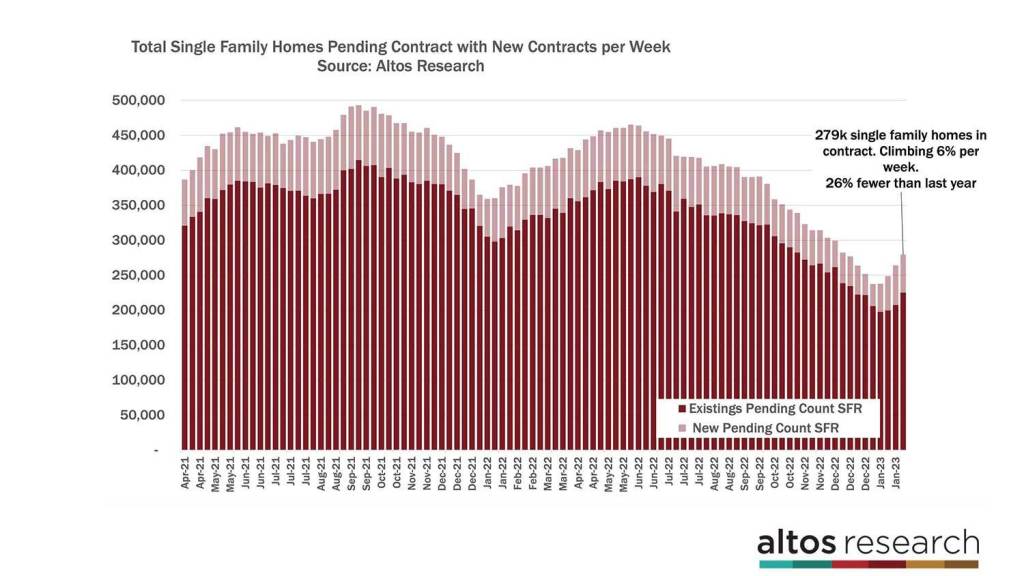
There are 26% fewer pending sales now than there were in 2022. However, homebuyers are quickly narrowing that gap. In 2022, at the end of the frenzy, there were 8% more new pending sales in the first week of February. This scenario illustrates what we mean when discussing home buyer demand. These numbers aren’t crazy, but they are sufficient. And it’s way better than it was in the fall.
Prices are steady
In fact, the price of the new pending sales increased in the beginning of February. It is a sign of pricing strength. The price of the homes under contract, $365,000, is flat year over year. This trend reflects both how strong the market used to be and how much it cooled in the last eight months. Remember that the pending sales indicate sales that will be completed in the future, roughly 30-60 days. Because of this, we can forecast that the price of home sales is likely to stay flat. Prices are not falling and the prices of homes going into contract aren’t jumping from here either.
The median price of single-family homes remains unchanged this week at $415,000. Despite tight supply, there is no pressure for home prices to increase in 2023. Mortgage rates are significantly more expensive than they have been in recent years, and while we’re hearing plenty of anecdotes about multiple offer scenarios, we’re not seeing evidence of overbidding.
In the chart below, we can start to see the trajectory of home prices in the dark red line. Historically, prices climb every spring with the best new inventory, but prices will be much slower to climb in 2023 than they were in 2022. Again, this is the signal that home prices will finish 2023 flat year over year from the end of 2022.
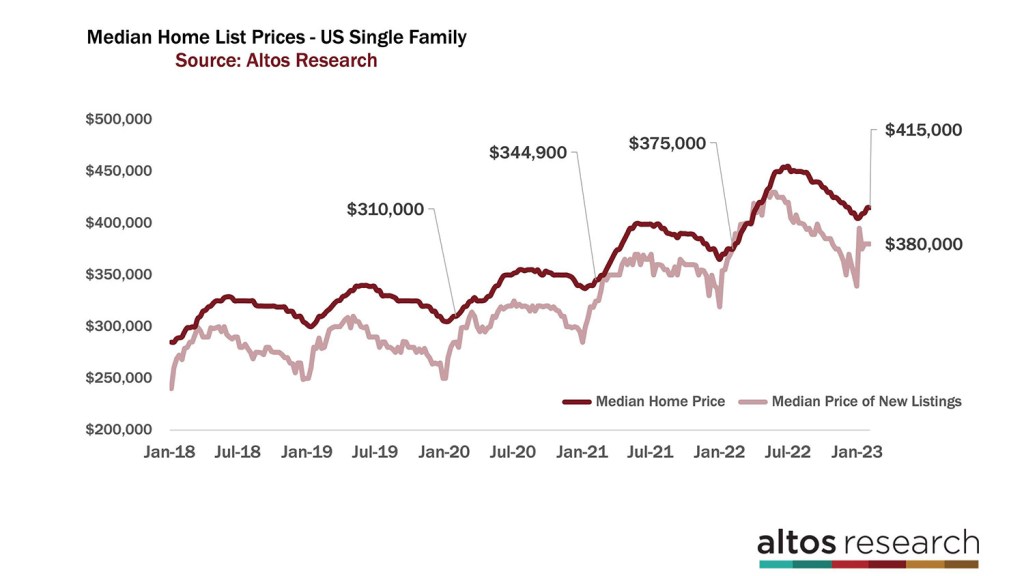
In fact, the price of new listings is just 1% above last year’s numbers when things were still rocketing at $380,000, see the light-colored line.
We will have to observe closely this next week: will the price of new listings be slightly negative year over year? It could happen. To re-iterate, this data is not representative of all home prices, only the leading indicator of where home sales will happen later in the season. Again, the data is pointing flat for 2023.
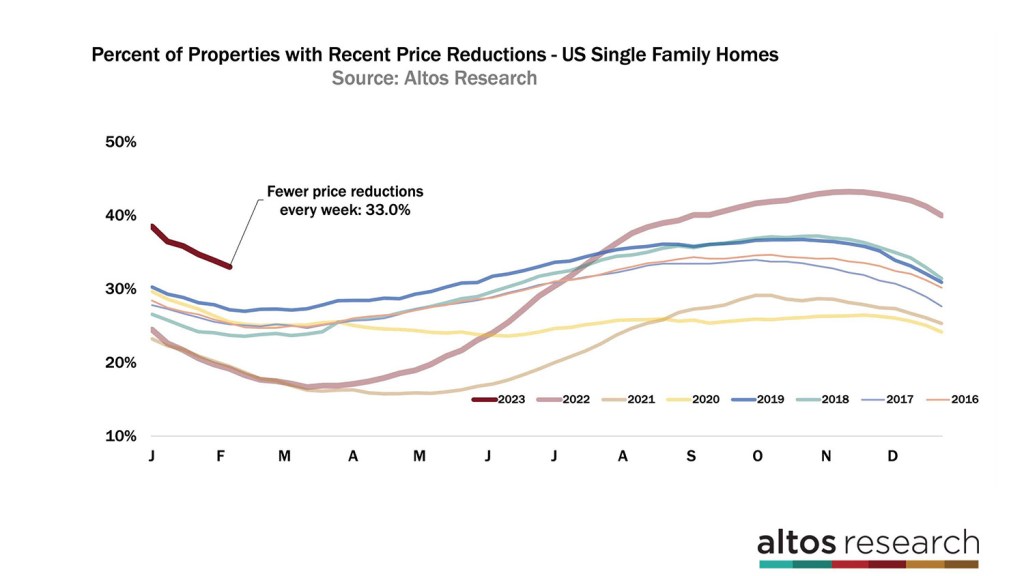
Price reductions are down to 33% of the market. It’s totally normal for one-third of the homes on the market to take a price cut before they sell. Price reductions don’t indicate a cold market. This is not a crashing market. This is not a market with panicky sellers. See the dark red line in the chart, it is declining quickly as buyers clear the inventory that didn’t sell in November and December of 2022. If you had a house on the market in November 2022 and it didn’t have any offers, you might have taken a price cut in December so it is selling now, in 2023.
But if you see headlines or social media fearmongers talking about a housing crash — ignore them. The market is improving, at least by this measure, rather than weakening. There is more demand and price stability.
Mike Simonsen is president of Altos Research.