


Available inventory of homes for sale has likely bottomed for the season, with a tiny uptick in inventory over last week. As we move later into January, the signals for the year start getting stronger. We’re hearing anecdotes from real estate professionals around the country reporting much healthier buyer interest than last fall. Of course, last fall was about as quiet as can be. The question is whether those interested home shoppers actually choose to buy this spring.
Every week, Altos Research tracks every home for sale in the country. We analyze all the pricing, supply and demand, and all the changes in that data and we make it available to you before you see it in the traditional channels. Here’s what we know from the first week of January.
Inventory ticked up slightly
Available inventory of homes for sale ticked up just a tiny fraction this week to 473,000 single family homes. It’s such a tiny move that you can’t really see it at the right side of this chart.
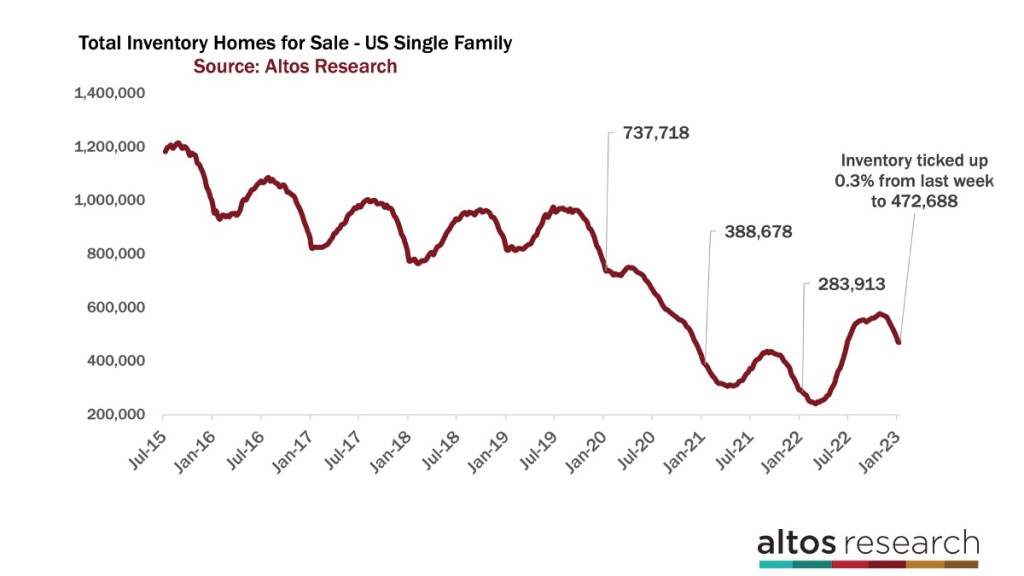
In early January it’s not uncommon for inventory to be at its seasonal low after the holidays. Next week’s numbers should see a bigger increase as more homes get listed for the spring. In the last two years, the pandemic years, inventory kept falling all the way into March or even April. But as mortgage rates have risen from the pandemic ultra lows, buyer demand backed off and that allows inventory to build in January like previous normal years.
The first of the spring market’s new listings arrive in January and inventory starts to build. This year, there are not a lot of new listings and also not a ton of buyer demand, so we’re just seeing a little inventory climb. Next week, will see a bigger jump.
Home buyers will have an easier go of it this spring than they’ve had in the last couple years, but you can see here that January of 2020, we had 737,000 houses on the market. We have 36% fewer homes now available.
Data doesn’t show flood of new inventory
I’ve said this a few times but I’ll repeat it here — there are no signs anywhere in the data that a big flood of new inventory is coming. Home buyers right now have limited competition, so you don’t have to fight for a home, but there’s also no reason to wait in hopes of some sudden better selection to arrive.
Spring will bring more inventory and total inventory may climb closer to the pre-pandemic normal levels later in the year, especially if rates stay above 6.5% or in the 7s. But that inventory growth is not coming suddenly.
Here’s what I mean by that. This week, the U.S. saw about 46,000 single-family homes get listed for sale. A handful of those took offers immediately. Compare that to last year at this time, when 56,000 homes were listed for sale in the second week of January but 17,000 of those were sold essentially immediately.
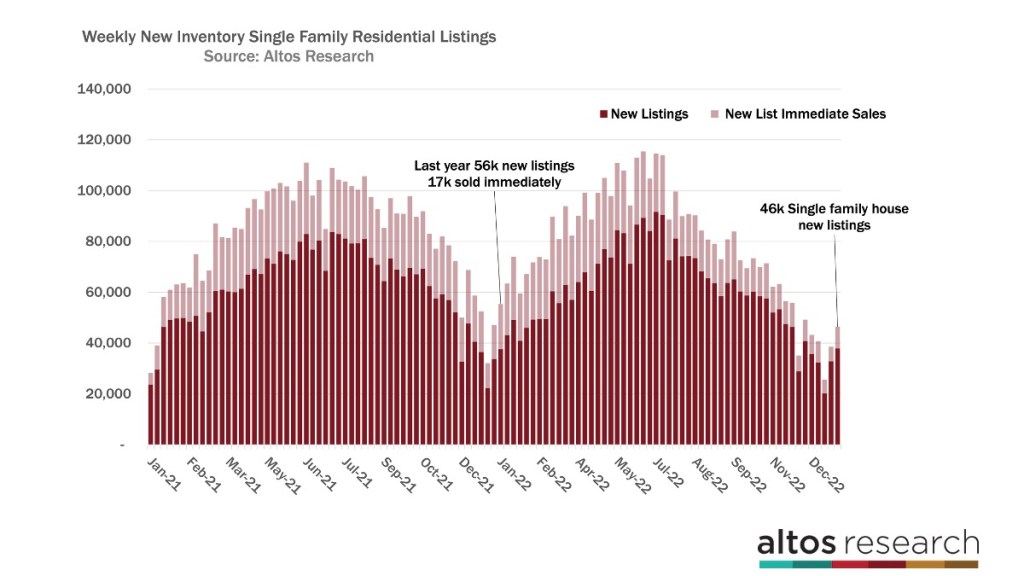
In this chart (above), each bar is the count of new listings in that week. The light portion are those that went into contract immediately — within hours or a few days. The immediate sales phenomenon was the defining characteristic of the pandemic home buying frenzy when mortgage rates were so incredibly low.
See how much bigger that light part of each bar was last year than it is now. Last year, inventory hit record lows because the new listing rate was low and demand was off the charts. Now the new listing rate is even lower, but demand is much much cooler. This is what I mean when there is nothing in the data that says a lot of sellers are coming. The two big catalysts for a slowing market are interest rates and employment. Both of those numbers have been trending better recently so where would any inventory come from?
We’ll spend more time with inventory projections for the year, and look at some of the macro economic influences this week Thursday in our monthly webinar. In the webinar we have an hour to go deep on a lot of this data and to look at the different local markets. There’s a link to register for that webinar in the description below.
Homes under contract tick up
The new sales rate has also turned the corner for the season. We have 238,000 single family homes in contract right now. That’s up just a little from last week. The number of homes in pending status is very low right now, because this stat reflects buyer activity from last quarter.
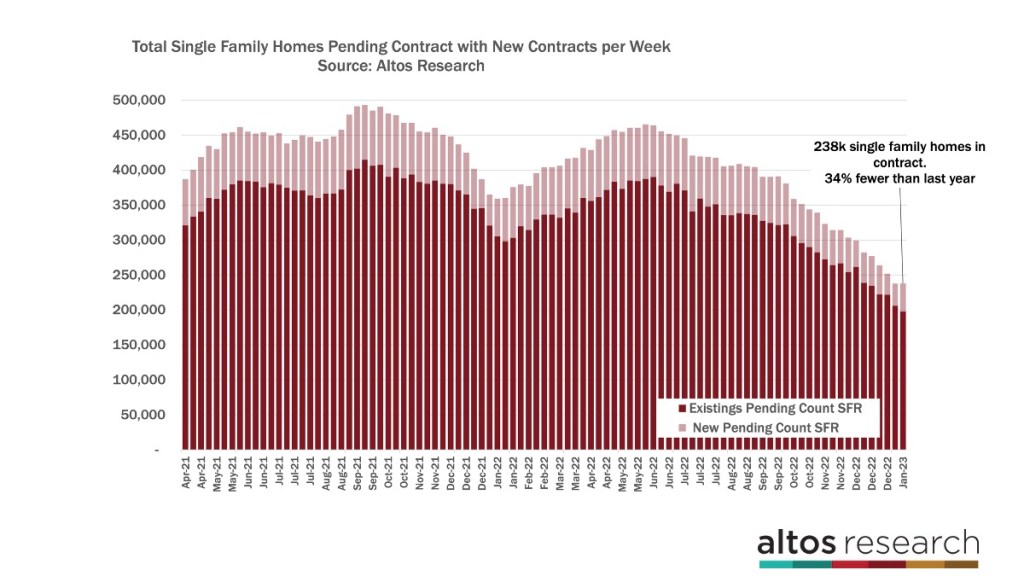
Homes can take 30 to 60 days or more in the contract process. We have 34% fewer homes in contract now than last year at this time. Each bar in this chart is a week with the total count of homes in contract. The light portion are those newly in contract. You can see how much lower each bar is right now than last year at this time.
Last year is the dip right in the middle of this chart. Since these are homes whose sale will complete in the future, you can be sure that the headline data on home sales you see in the next several months will continue to be very bearish. We’ll keep our eyes on this data over the next several weeks to see if those home shoppers I mention are buying or if they just keep shopping.
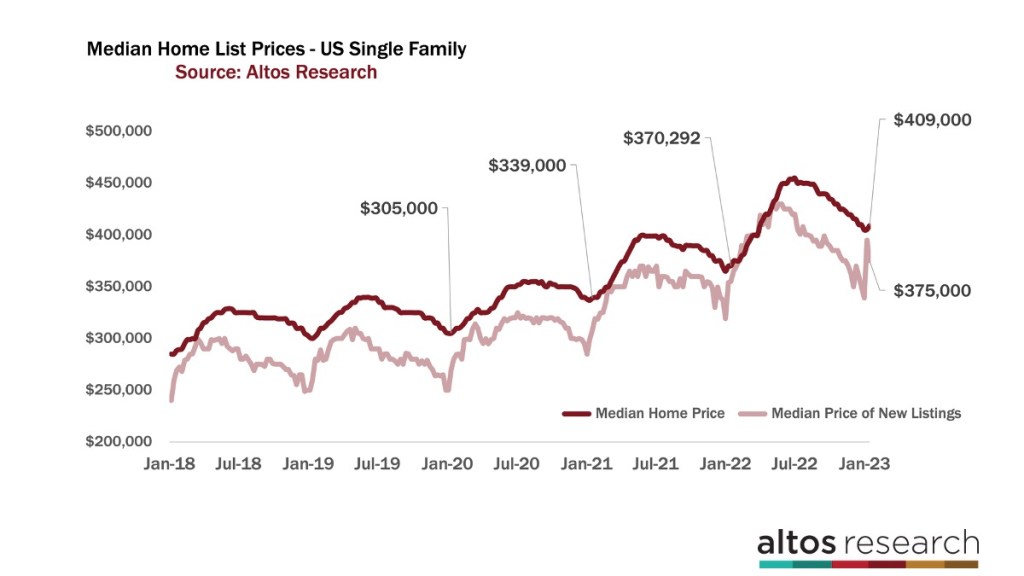
And after the first of the year, better new listings start coming to market so home prices start their seasonal rise. This week the median price of single family homes rose just under 1% to $409,000. For the active listings that’s still plenty above last year at this time which is interesting to note. Last year’s bidding wars meant the ultimate sales price was higher than list and now we’re back to normal where sales price is a little under list price on average.
The median price of the new listings declined this week to $375,000 after last week’s oddly big jump. I wouldn’t read too much into this. We have very few new listings each week so the median price may be a bit noisy.
What we’re looking for in the light red line is how quickly it climbs over the next few weeks and for the rest of the quarter. It can bounce a bit but this is the reading of what sellers know about their potential buyers.
The most important thing to take away from this chart is that the most bearish scenarios for home prices this year are not taking place. Sellers and listing agents know where the demand is and in aggregate they price to sell. So it’s early January, home prices are just starting to tick up in a normal seasonal pattern. If you have a buyer sitting on the sidelines waiting for a home price crash, in general across the country that’s not happening. In the webinar Thursday we’ll spend some time looking at the local markets where we can indeed see prices declining but on the national scale, no panic.
Almost 36% of homes have had a price reduction
We can measure demand and the direction of future sales prices by looking at the percent of homes on the market with price reductions. This number frankly has been falling faster than I would have expected given how few buyers were out in the fall. 35.8% of the homes on the market have taken a price cut recently.
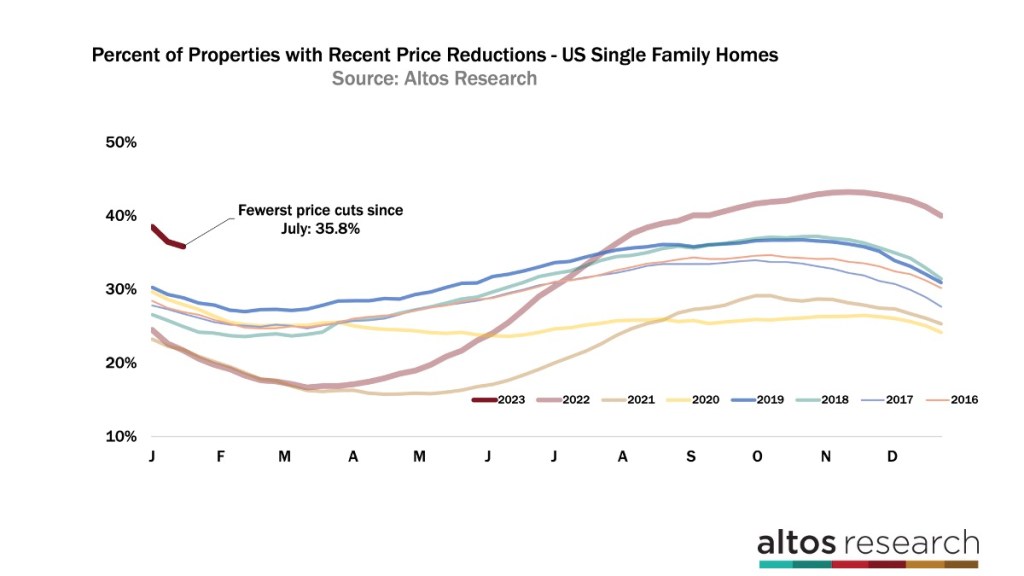
In this chart each line is a year. You can see the tight band of normal price cut behavior around 30-35% of the market. You can see 2023 starts at the left end of the chart. We have fewer price cuts now than at any time since July. The buyers are still few enough in this market that I wouldn’t expect this year’s curve to get back down to that tight band of normal from the years before the pandemic.
This is a sign that sellers are not panicking, That smart properly priced listings are getting their offers. It’s also a signal that over priced listings have no chance. But I suppose that doesn’t need to be said. Does it?
