Existing-Home Sales Slid 4.9% in March
Existing-home sales retreated in March, following February’s surge of sales, according to the National Association of Realtors®. Each of the four major U.S. regions saw a drop-off in sales, with the Midwest enduring the largest decline last month.
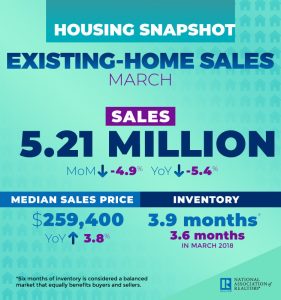
Total existing-home sales, completed transactions that include single-family homes, townhomes, condominiums and co-ops, fell 4.9% from February to a seasonally adjusted annual rate of 5.21 million in March. Sales as a whole are down 5.4% from a year ago (5.51 million in March 2018).
 March 2019 Existing Home Sales Infographic
Lawrence Yun, NAR’s chief economist, anticipated waning in the numbers for March. “It is not surprising to see a retreat after a powerful surge in sales in the prior month. Still, current sales activity is underperforming in relation to the strength in the jobs markets. The impact of lower mortgage rates has not yet been fully realized.”
The median existing-home price for all housing types in March was $259,400, up 3.8% from March 2018 ($249,800). March’s price increase marks the 85th straight month of year-over-year gains.
Total housing inventory at the end of March increased to 1.68 million, up from 1.63 million existing homes available for sale in February and a 2.4% increase from 1.64 million a year ago. Unsold inventory is at a 3.9-month supply at the current sales pace, up from 3.6 months in February and up from 3.6 months in March 2018.
“Further increases in inventory are highly desirable to keep home prices in check,” says Yun. “The sustained steady gains in home sales can occur when home price appreciation grows at roughly the same pace as wage growth.”
Properties remained on the market for an average of 36 days in March, down from 44 days in February but up from 30 days a year ago. Forty-seven percent of homes sold in March were on the market for less than a month.
Yun says tax policy changes will likely add further complications to the housing sector. “The lower-end market is hot while the upper-end market is not. The expensive home market will experience challenges due to the curtailment of tax deductions of mortgage interest payments and property taxes.”
Realtor.com®‘s Market Hotness Index, measuring time-on-the-market data and listing views per property, revealed that the hottest metro areas in March were Columbus, Ohio; Boston–Cambridge–Newton, Mass.; Midland, Texas; Sacramento—Roseville–Arden-Arcade, Calif.; and Stockton–Lodi, Calif.
According to Freddie Mac, the average commitment rate for a 30-year, conventional, fixed-rate mortgage decreased to 4.27% in March from 4.37% in February. The average commitment rate across all of 2018 was 4.54%.
“We had been calling for additional inventory, so I am pleased to see that there has been a modest increase on that front,” said NAR President John Smaby, a second-generation Realtor® from Edina, Minnesota and broker at Edina Realty. “We’re also seeing very favorable mortgage rates, so now would be a great time for those buyers who may have been waiting to make a purchase.”
First-time buyers were responsible for 33% of sales in March, up from last month and a year ago (32% and 30%). NAR’s 2018 Profile of Home Buyers and Sellers – released in late 2018 – revealed that the annual share of first-time buyers was 33%.
All-cash sales accounted for 21% of transactions in March, down from February’s 23%, but up from a year ago (20%). Individual investors, who account for many cash sales, purchased 18% of homes in March, up from February’s 16%, and up from a year ago (16%).
Distressed sales – foreclosures and short sales – represented 3% of sales in March, down from 4% last month and down from 4% in March 2018. One percent of March 2019 sales were short sales.
Single-family and Condo/Co-op Sales
Single-family home sales sit at a seasonally adjusted annual rate of 4.67 million in March, down from 4.91 million in February and down 4.7% from 4.90 million a year ago. The median existing single-family home price was $261,100 in March, up 3.8% from March 2018.
Existing condominium and co-op sales were recorded at a seasonally adjusted annual rate of 540,000 units in March, down 5.3% from last month and down 11.5% from a year ago. The median existing condo price was $244,400 in March, which is up 3.6% from a year ago.
Regional Breakdown
March existing-home sales numbers in the Northeast decreased 2.9% to an annual rate of 670,000, 1.5% below a year ago. The median price in the Northeast was $277,500, which is up 2.5% from March 2018.
In the Midwest, existing-home sales declined 7.9% from last month to an annual rate of 1.17 million, 8.6% below March 2018 levels. The median price in the Midwest was $200,500, which is up 4.6% from last year.
Existing-home sales in the South dropped 3.4% to an annual rate of 2.28 million in March, down 2.1% from last year. The median price in the South was $227,400, up 2.4% from a year ago.
Existing-home sales in the West fell 6.0% to an annual rate of 1.09 million in March, 10.7% below a year ago. The median price in the West was $389,300, up 3.1% from March 2018.


