


Mortgage rates have been stubbornly above 7% for two months and it sure looks like home buyers are growing weary. We can see signs that buyers are slowing, both in the sales volume and in the sales price data. This slowdown is not like last year, instead, it’s just slightly fewer buyers each week. As a result, sales volumes are inching down — making slightly worse comparisons to last year.
This is a different trend from January through June when demand was higher than we expected. It was mid-June when it looked like mortgage rates might continue to ease down but then the opposite happened. Rates rose from six to seven and that affordability impacts buyers.
These subtle shifts are useful to watch each week so that we’re not surprised when some monthly number in the news comes in below expectations.
Inventory
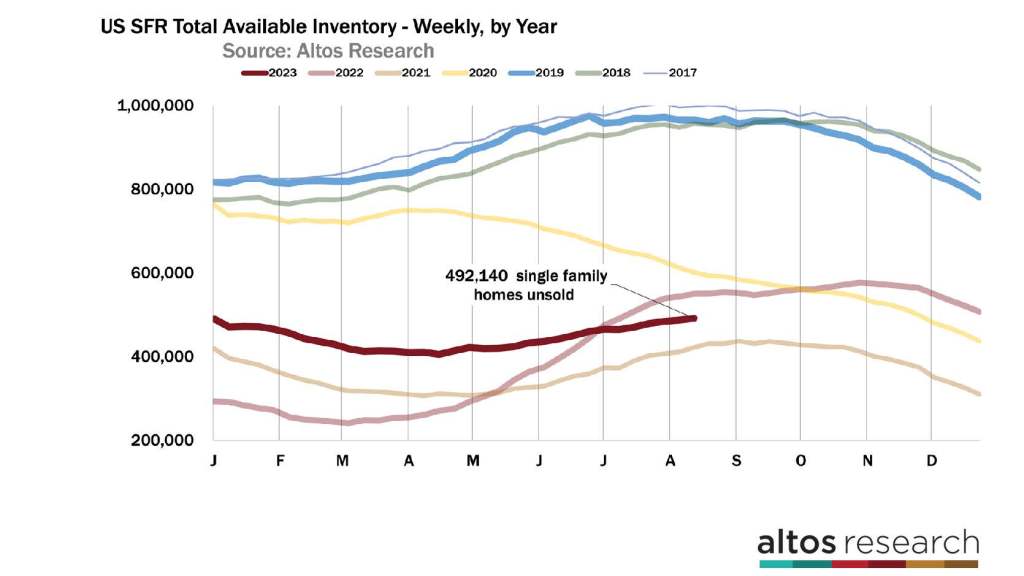
Available inventory of unsold single-family homes ticked up again by less than 1% again this week to 492,000. This is a seasonal inventory gain. There are 10% fewer homes on the market now than last year at this time. But the data appears to be showing one of the signals of slightly fewer buyers. In the first half of the year, inventory declined because demand was greater than the season would indicate. Now, that extra little boost of demand seems to be gone from the housing market.
At Altos, we’ve been saying it looks like the available inventory of homes for sale will peak in two weeks — at the end of August — and start declining for the fall season. In the chart above you can see the dark red line for this year is right on a normal curve for inventory. See how the tan line of 2021 peaked right about on the same curve we’re seeing this year? The data for normal seasonality balance says that we’re almost at peak inventory.
Assuming inventory peaks in two weeks also assumes mortgage rates don’t spike from here. While the inflation data has been steadily improving each month, the economy has stayed strong for longer than nearly anyone anticipated. As a result, rates haven’t gone down. If the economy reports surprising growth again this month and quarter, you could imagine a scenario where mortgage rates go up from here.
When thinking about where housing inventory goes from here, it is important to remember this rule of thumb — call it the Altos Rule: higher mortgage rates equals higher inventory. Lower rates lead to lower inventory. Higher mortgage rates create greater holding costs for real estate therefore fewer people hold real estate, and there are more sales, more inventory. Lower mortgage rates spur demand and hoarding of homes so there is get less inventory.
There are about 10% fewer homes on the market now than there were in 2022 at this time. In 2022, mortgage rates climbed rapidly and inventory climbed rapidly. That’s the Altos Rule. When mortgage rates eased down in the beginning of the year, so did the available inventory of unsold homes. Now, rates are not falling. They’re staying stubbornly higher around 7% so inventory hasn’t yet started its decline for the fall. Look for that decline to start in September with fewer sellers, unless rates jump like they did last September. At Altos, we don’t predict mortgage rates. We measure the housing market.
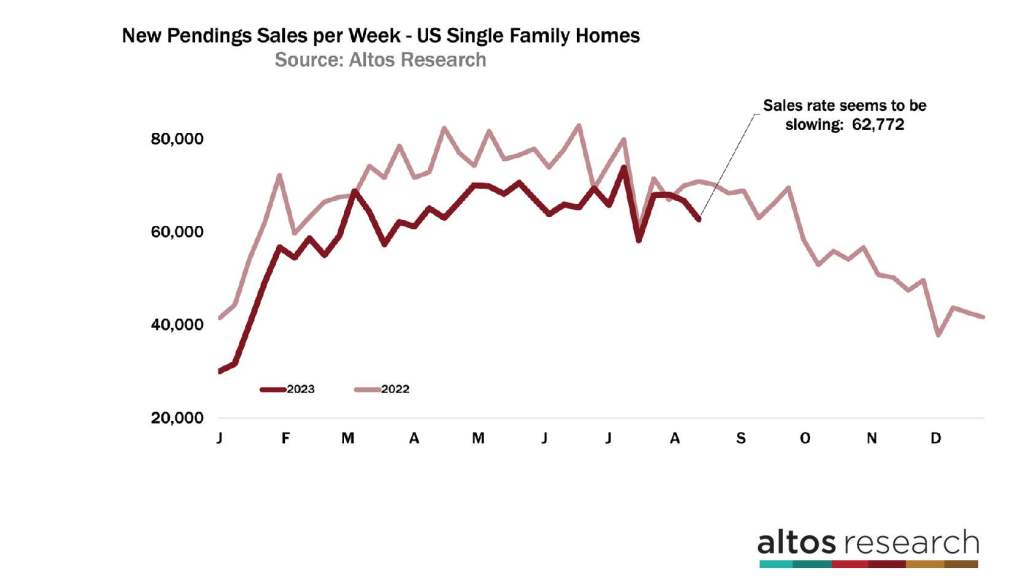
If we look at the transaction rate each week — the total number of new contracts for homes — you can see that in the first half of the year, the pace of sales was steadily returning to normal. The dark red line was approaching the light red line representing 2022. When mortgage rates jumped to 7% in June, there were fewer home sales each week. There were 63,000 new pending sales in the single-family category this week. That’s 11% fewer than in 2022 at this time. For a few weeks there it looked like our sales rate might finally eclipse the slowdown from last year. But these higher rates are putting just enough of a damper on supply and demand that the pace of sales seems to have slowed again.
Price
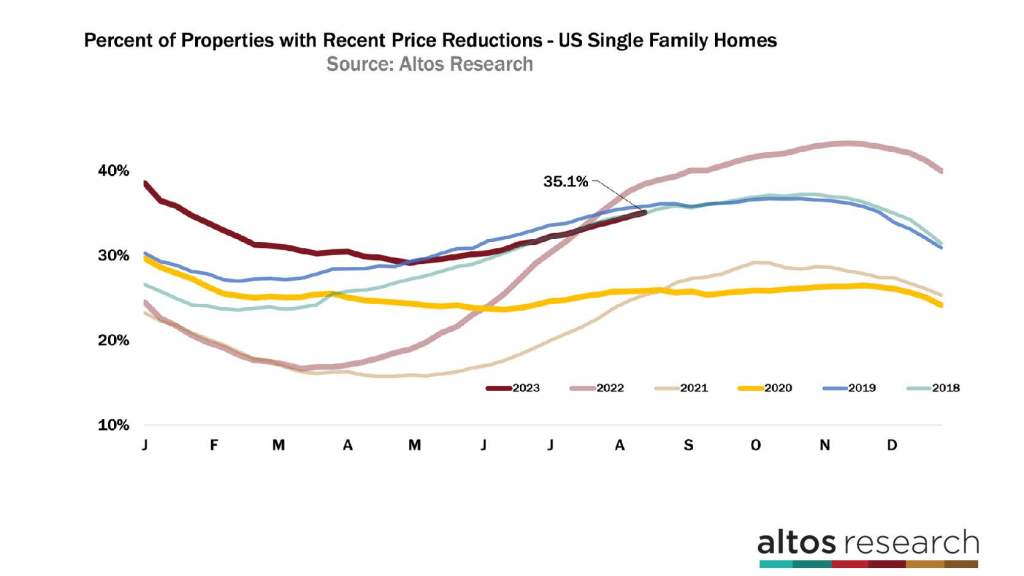
You can see the nuance of a slowdown in the price reduction data too. 35.1% of the homes on the market have taken price cuts. That’s climbing by about 50 basis points per week. It’s not a lot, this leading indicator does not show prices falling. But it’s showing slightly more weakness than earlier in the year. In the chart below, notice the dark red line improved dramatically earlier in the year. It dropped from cold into the normal range. In 2022, the market was changing rapidly. The light red line represents how many price cuts were happening each week.
This summer slowdown is much more subtle. Consumers are sensitive to higher mortgage rates. There are slightly fewer offers each week, so there are slightly more price reductions. Price cuts don’t typically peak until October, so it’s the slope of the dark red line that we’re paying attention to now. And, the year could end with more price cuts than any recent year except 2022. Stronger than last year, but cooler than the surprising first few months of 2023.
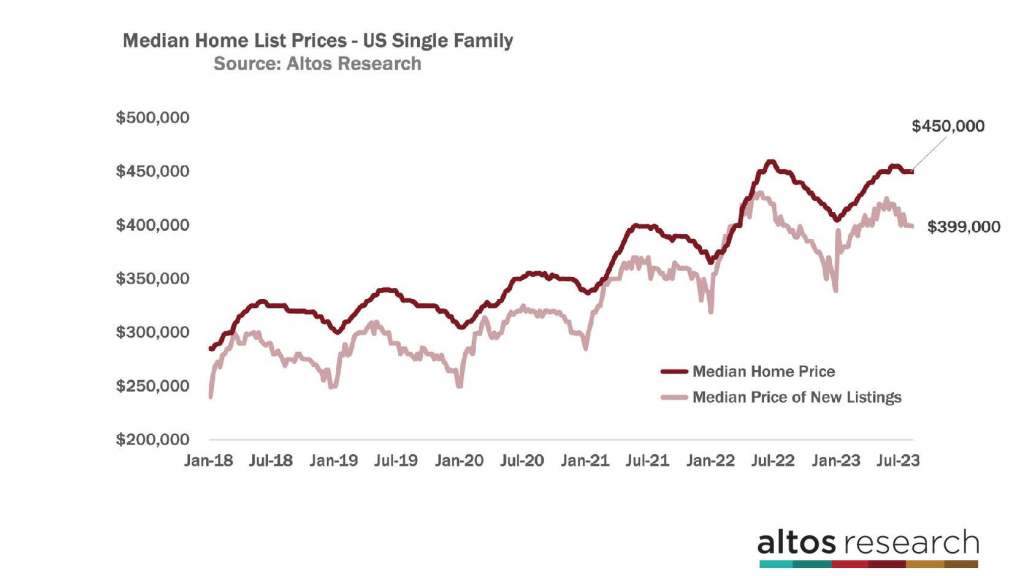
Home prices are holding steady each week. The median price of single-family homes in the U.S. is just under $450,000. That’s basically unchanged for four weeks in a row. And it’s almost exactly the same as a year ago. Home prices are just a tiny sliver higher than they were in 2022 at this time.
The median price of the newly listed cohort ticked down a fraction for $399,000. That’s also a tiny sliver higher than it was in 2022. See how the light red line has a steady decline in the second half of the year each year? Last year was a steeper-than-normal decline. So this home price measure should tick down over the next couple of months as is normal for the late summer and early fall. If you’re listing your house late in the year, you tend to take a slight discount to make sure it moves before the end of the summer or before the holidays. So while I’ve been pointing out slight buyer weakness it will be important to watch the price of the new listings each week to see if that price weakness accelerates like it did last year.
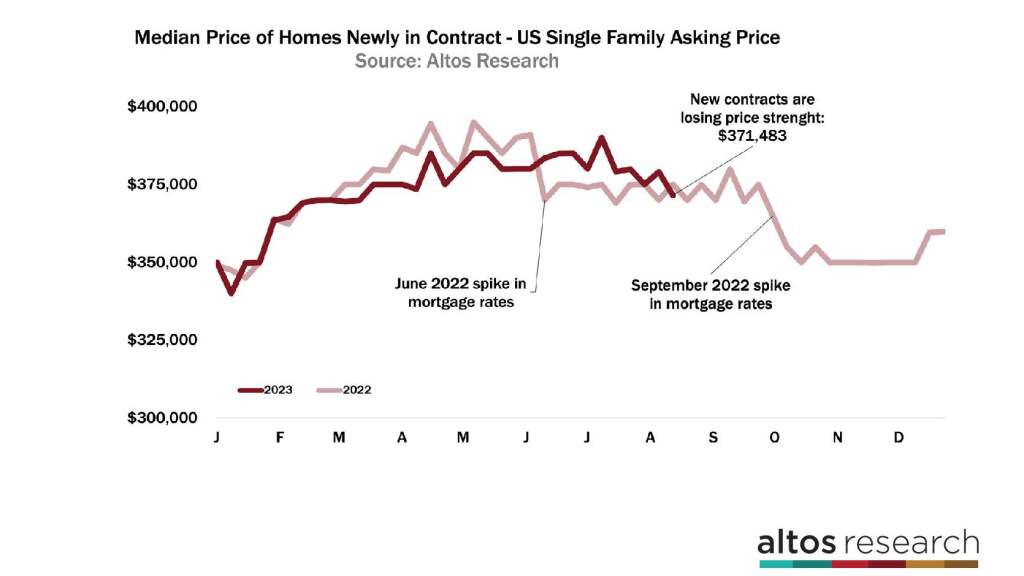
The median price of all the homes that went into contract this week is $371,483. That’s almost 2% lower than last week and a fraction lower than the data from 2022. In the last few weeks, the data has shown the price of the pending sales dropping as mortgage rates have stayed over 7%. This makes sense with the other data I’ve shared here today. In this chart, notice the dark red line has been trading higher than the light red line for several months.
This week, you can see that the latest home sales prices dipped below last year. Now, I don’t see this as home prices falling dramatically and because they did fall dramatically in September of 2022, home prices will likely end the year up a few percentage points over 2022 data. But, consumers are very sensitive to mortgage rates and rates are inching up. The higher those rates go, the more at risk the annual home price appreciation is.
That’s really something to keep our eyes on in the coming weeks.
More next week.
Mike Simonsen is the president and founder of Altos Research.
