


We are two months into 2023 and even while Altos has been reporting surprisingly resilient home-buying activity, there is not nearly enough demand to change the view that home prices will be flat to slightly down for the year nationally. As the pricing data for 2023 becomes more mature, it shows how quickly last year’s prices will catch up with this year’s.
Inventory is falling still, so the supply side of the supply/demand equation helps put a floor on prices. There are so few homes for sale that this market will likely remain tight all year. Rising mortgage rates don’t appear to be adding much to inventory, but they are keeping prices lower. This situation creates an affordability issue.
Pricing
The trend in home prices is probably the most notable data point right now. At $420,000, home prices are still higher, nationally, over 2022 at this time. All that margin was gained in March, April and May of 2022.
There are markets where home prices are lower than in 2022 at this time. And a few markets — like San Francisco — where prices are lower than they were two years ago. But in general, home prices are still about 6% higher than in 2022. At that time, prices were still sprinting higher each week as buyers fought to get in before mortgage rates jumped. As a result, each week our yearly price gain is eroding.
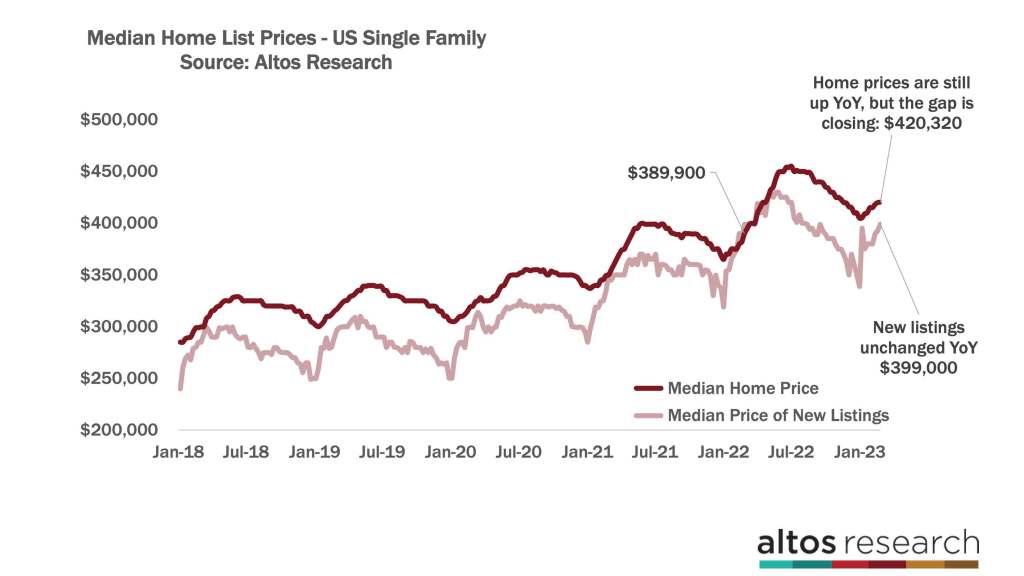
The median price of single-family homes in the U.S. is $420,320. That’s up from last week. Normally during this time of year, home prices are bumping up rapidly each week with new inventory and more buyer demand. The dark red line here is not indicating that higher sprint. At the far right end of the chart above, we can see the low slope of appreciation. It seems like the market is at a price ceiling.
Buyers are buying some homes, but the mortgage rate affordability problem is keeping that lid on prices. Prices will tick up through June, but they will move much slower than in recent years. At this pace, prices will peak significantly under the peak price of June 2022.
The median price of the new listings is $399,000 and that’s already the same level from 2022 at this time. New sellers know where the demand is and in aggregate price very close to the eventual sales price. The 0% change in year-over-year new listing prices implies 0% change in year-over-year future sales prices. That tells supplies a ton of data for the year. Next week the percent change might be negative for the first time, because last year prices were still spiking so quickly. That’s the light-colored line in the chart.
It’s notable too that the median price of the pending sales is $370,000. This data point is also unchanged from 2022. The pending sales are the homes in contract but not yet closed. Last year’s pending sales price was a little understated because the market still saw overbidding. When these pending sales close, the prices will be at or below 2022 sales prices. The homes that are pending contract now will close in March and April. So, be ready for those headlines in the next few months. Home sales prices will be down year over year.
Sales prices are a lagging indicator of the market, though. A home that is listed today, gets an offer in March, it closes in April or May and you hear the data in June. While it’s true that sales price headlines will start reporting flat to down in a few months, I prefer to focus on what’s happing in the market right now.
Inventory
The big thing to note right now is that the available inventory of homes for sale declined by another 1.5% this week to just under 430,000. There is no indication anywhere in the data that we have a flood of new inventory coming. You can hear plenty of hypotheses about where future inventory might come from, but none of that is in the market now. Home prices are down and there’s no supply-side catalyst for a big bubble-bursting correction.
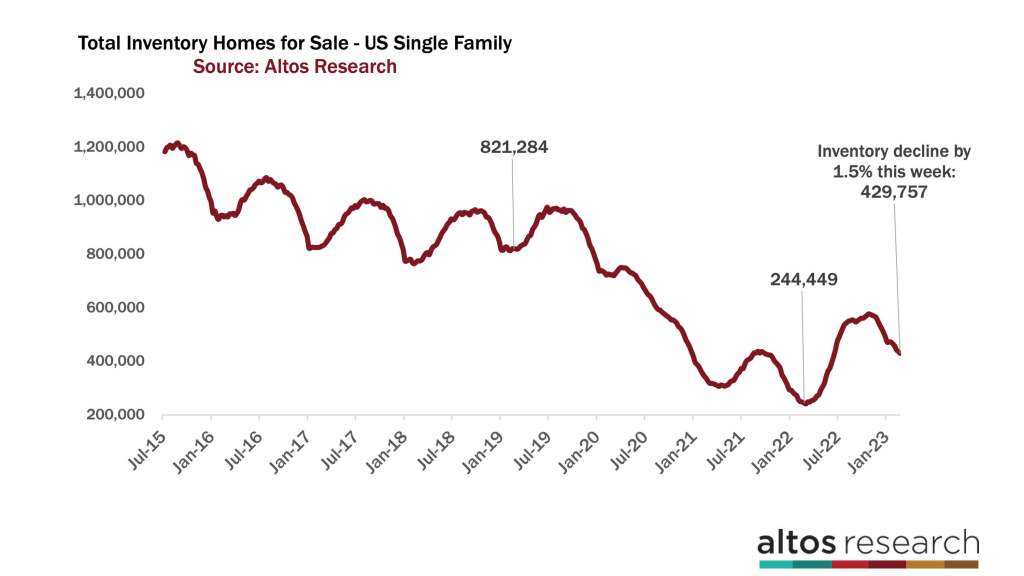
There are 60,000 fewer single-family homes on the market now than there were over the New Year’s weekend. Coming out of the 4th Quarter we expected a continuation of the market freeze which would mean rising inventory in the first quarter. Our forecasting model from that moment expected we’d have well over 500,000 single-family homes available right now. Each week the data has shown the opposite. There are fewer new sellers and slightly more buyers.
There are a lot more homes on the market now than in 2022 at this time, but 48% fewer homes are for sale right now than there were in 2019. Back then, there were 821,000 single-family homes on the market.
I expect inventory to fall for one more week before a slight increase as we approach mid-March. Spring inventory is coming. The data has not shown a meaningful surge in inventory even as mortgage rates surged a few weeks ago. There also hasn’t been a dramatic slowdown in buyers, not enough to reverse the 2023 trend.
There continue to be significantly fewer new listings each week than there were in 2022. Only 60,000 new homes were listed this week, with 14,000 of those going into contract immediately. In 2022 at this time there were 73,000 new listings with 24,000 of them going into contract immediately.
In the chart below, each bar is a week representing the total count of new listings. You can see this week’s bar is much shorter than the 2022 bar at this time. There are 18% fewer new listings. The light portion of the bar represents those homes that went into contract essentially immediately after listing. This is what I mean when I say there’s no sign of any surge in inventory. The folks who are the most bearish on the U.S. housing market insist that we will see a big surge in inventory. That hasn’t happened yet. When it does we’ll see it here first.
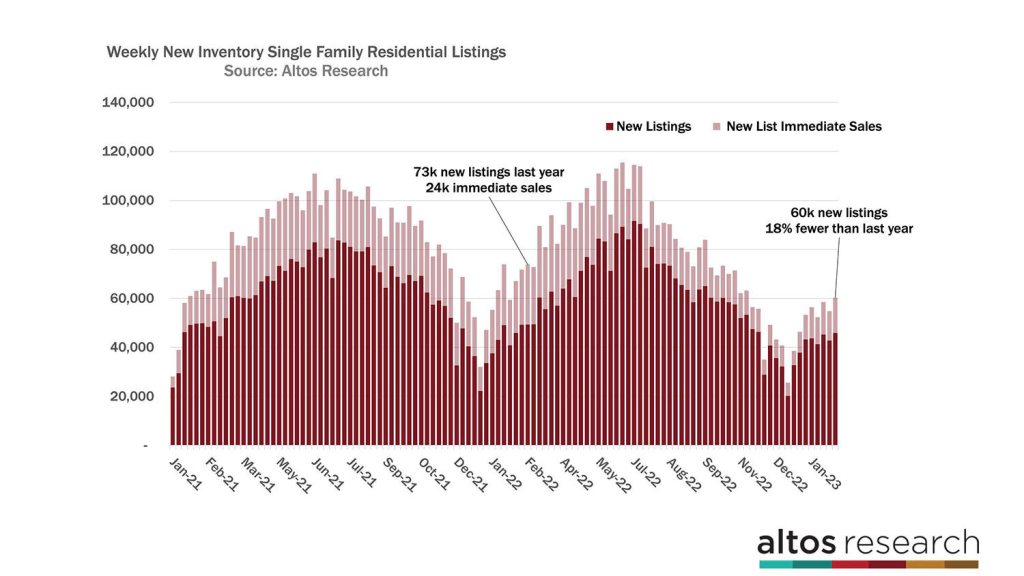
At the right end of the chart, you can see the new listing rate is still very suppressed. Hopefully, in the next couple of weeks, the data will show some March inventory to help the market. In March 2022, there were big spike weeks climbing to peak at the end of June.
There are some markets like Austin, Texas and Phoenix where inventory climbed dramatically last summer. So in those markets, the current available inventory is around 2019 levels. Most of the country still experiencing inventory lows. Interestingly, even in those markets, right now the new listing volume is very low. Those markets are not growing inventory now like they did last year. If you’re latching onto reports that cite rising inventory as a sign of a market crash, you’re probably misinformed. You’re looking at old data.
Pending Sales
There are 319,000 single-family homes in the contract pending stage. That’s a 4% increase from last week. But of course, that is 21% fewer than in 2022 at this time. 21% fewer sales is a huge difference in the market.
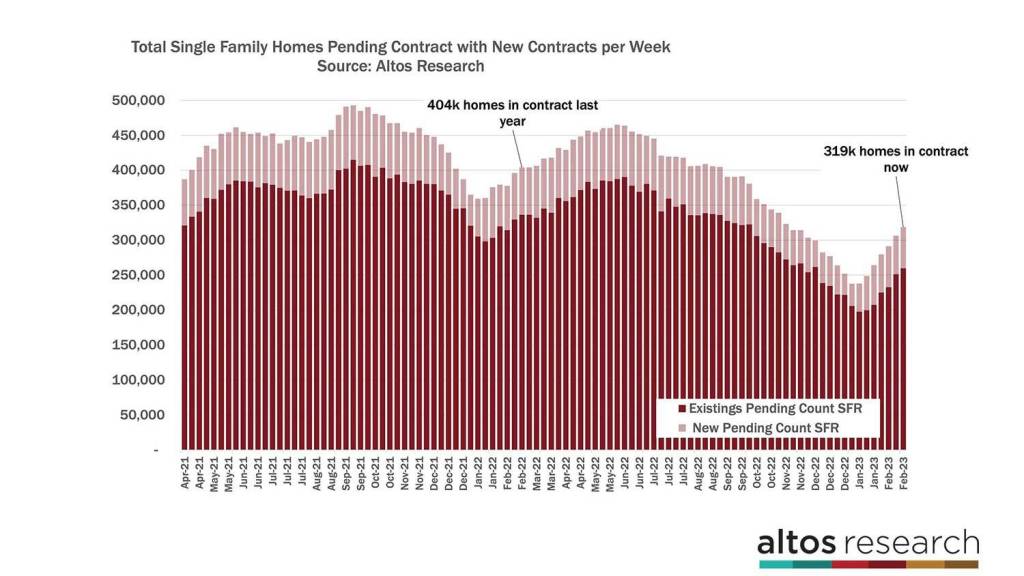
This week continues the trend of a normal, seasonal climb with enough people buying the limited houses for sale that we see an obvious turnaround from the weak second half of 2022. In the chart below, each bar represents a week with the total number of homes with sales contracts pending. At the right end of the chart, there is steady growth from the very low New Year’s levels. This is what the data has shown each week. It’s notably different than in say November 2022.
There were 59,000 newly pending sales this week. That’s the light portion of the bar. There isn’t an obvious slowdown of new pending sales as mortgage rates pushed higher over the last several weeks. Even though mortgage purchase applications have taken a dive. It could be that we have such low levels of inventory that even in a time when demand falls, this is still a supply constrained market. Or maybe it will take more time before we can really start measuring 7% mortgage rates in the pending sales numbers.
Mortgage rates rising to close to 7% won’t create a surge in people rushing to buy. The sales rate will stay well below the pace from 2022.
Price Cuts
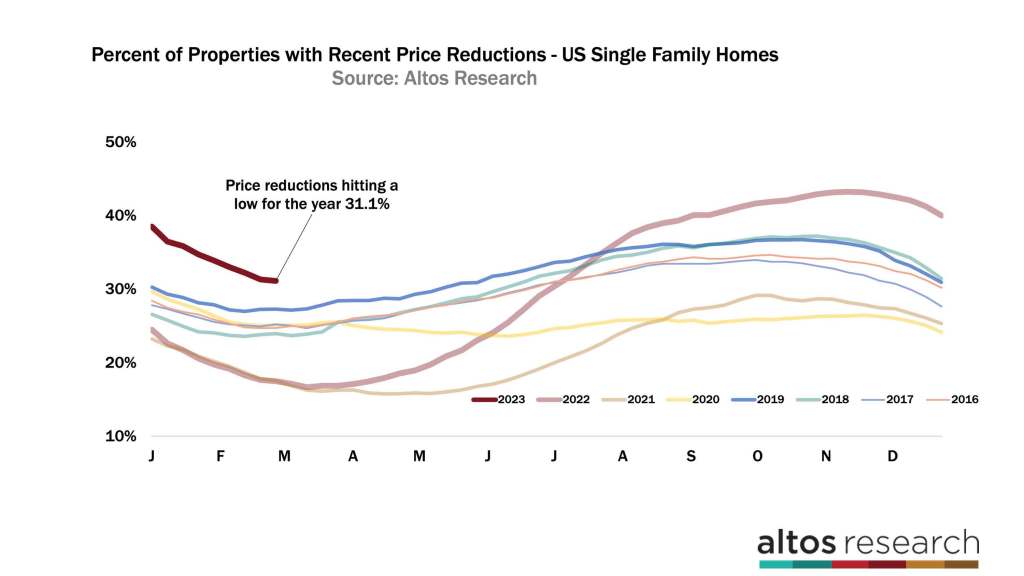
If there’s no rush to buy, then those homes that sit on the market may need a price cut. As we’ve had surprising levels of demand this new year, price reductions have been falling quickly. Fewer homes need a price cut. That pace leveled off this week. 31.1% of the homes on the market have taken a price cut. You can imagine if a handful of homes watched rates spike, and noticed that none of their potential bidders made an offer, that some of those folks cut their prices this week. So the price reduction curve is reaching its bottom as rates climb.
Since this year’s curve is above the recent years, price reductions are another indicator that the market is significantly less scary than it was in 2022, but it is significantly slower than we’ve seen it in recent years.
More next week.
