Existing Home Sales Declined in April
Existing-home sales saw a minor decline in April, continuing March’s drop in sales, according to the National Association of Realtors®. Two of the four major U.S. regions saw a slight dip in sales, while the West saw growth and the Midwest essentially bore no changes last month.
Total existing-home sales1, https://www.nar.realtor/existing-home-sales, completed transactions that include single-family homes, townhomes, condominiums and co-ops, fell 0.4% from March to a seasonally adjusted annual rate of 5.19 million in April. Total sales are down 4.4% from a year ago (5.43 million in April 2018).
Lawrence Yun, NAR’s chief economist, said he is not overly concerned about the 0.4% dip in sales and expects moderate growth very soon. “First, we are seeing historically low mortgage rates combined with a pent-up demand to buy, so buyers will look to take advantage of these conditions,” he said. “Also, job creation is improving, causing wage growth to align with home price growth, which helps affordability and will help spur more home sales.”
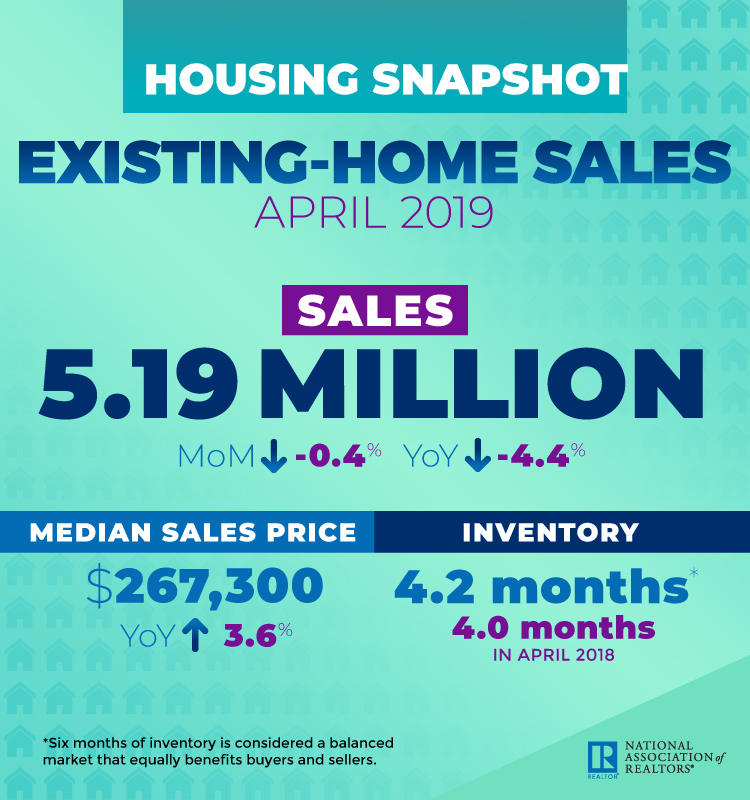
The median existing-home price2 for all housing types in April was $267,300, up 3.6% from April 2018 ($257,900). April’s price increase marks the 86th straight month of year-over-year gains.
Total housing inventory3 at the end of April increased to 1.83 million, up from 1.67 million existing homes available for sale in March and a 1.7% increase from 1.80 million a year ago. Unsold inventory is at a 4.2-month supply at the current sales pace, up from 3.8 months in March and up from 4.0 months in April 2018.
“We see that the inventory totals have steadily improved, and will provide more choices for those looking to buy a home,” Yun said. He notes that sellers have to realize that price growth has moderated. “When placing their home on the market, home sellers need to be very realistic and aware of the current conditions.”
Properties remained on the market for an average of 24 days in April, down from 36 days in March and down from 26 days a year ago. Fifty-three percent of homes sold in April were on the market for less than a month.
Yun says that college student debt continues to hinder millennial homebuyers. “Given the record high job openings in the construction sector, some may want to take a gap year to work there and save, and thereby lessen the student debt burden.”
Realtor.com®’s Market Hotness Index, measuring time-on-the-market data and listing views per property, revealed that the hottest metro areas in April were Boston-Cambridge-Newton, Mass.; Lafayette-West Lafayette, Ind.; Spokane-Spokane Valley, Wash.; Columbus, Ohio; and Sacramento–Roseville–Arden-Arcade, Calif.
According to Freddie Mac, the average commitment rate (link is external) for a 30-year, conventional, fixed-rate mortgage decreased to 4.14% in April from 4.27% in March. The average commitment rate across all of 2018 was 4.54%.
“I think the market had a bit of a slow start in the Fall, but Realtors® all over the country have been telling me that April was a nice rebound. We’re hopeful and expect that this will continue heading into the summer,” said NAR President John Smaby, a second-generation Realtor® from Edina, Minnesota and broker at Edina Realty. “Homes over the last month sold quickly, which is not only a win-win for buyers and sellers, but it’s also great for the real estate industry.”
First-time buyers were responsible for 32% of sales in April, down from the 33% reported last month and one year ago. NAR’s 2018 Profile of Home Buyers and Sellers—released in late 20184—revealed that the annual share of first-time buyers was 33%.
All-cash sales accounted for 20% of transactions in April, down from March and a year ago (21% in both cases). Individual investors, who account for many cash sales, purchased 16% of homes in April, down from March’s 18%, but up from a year ago (14%).
Distressed sales5—foreclosures and short sales—represented 3% of sales in April, equal to the 3% in March and down from 4% in April 2018. One percent of April 2019 sales were short sales.
Single-family and Condo/Co-op Sales
Single-family home sales sat at a seasonally adjusted annual rate of 4.62 million in April, down from 4.67 million in March and down 4.0% from 4.81 million a year ago. The median existing single-family home price was $269,300 in April, up 3.7% from April 2018.
Existing condominium and co-op sales were recorded at a seasonally adjusted annual rate of 570,000 units in April, up 5.6% from the prior month and down 8.1% from a year ago. The median existing condo price was $251,000 in April, which is up 3.4% from a year ago.
Regional Breakdown
April existing-home sales numbers in the Northeast decreased 4.5% to an annual rate of 640,000, 4.5% below a year ago. The median price in the Northeast was $277,700, up 0.9% from April 2018.
In the Midwest, existing-home sales saw relatively no percentage change from the month prior, as the annual rate remained 1.17 million, which is 7.9% below April 2018 levels. The median price in the Midwest was $210,500, an increase of 5.5% from a year ago.
Existing-home sales in the South modestly dropped 0.4% to an annual rate of 2.27 million in April, down 1.7% from a year ago. The median price in the South was $236,800, up 4.4% from a year ago.
Existing-home sales in the West grew 1.8% to an annual rate of 1.11 million in April, 5.9% below a year ago. The median price in the West was $395,100, up 1.3% from April 2018.
The National Association of Realtors® is America’s largest trade association, representing more than 1.3 million members involved in all aspects of the residential and commercial real estate industries.