CoreLogic Reports May Home Prices Increased by 7.1 Percent
- In Hottest Markets, Renters’ Desire to Buy Outpaces Available Sellers by Four Times
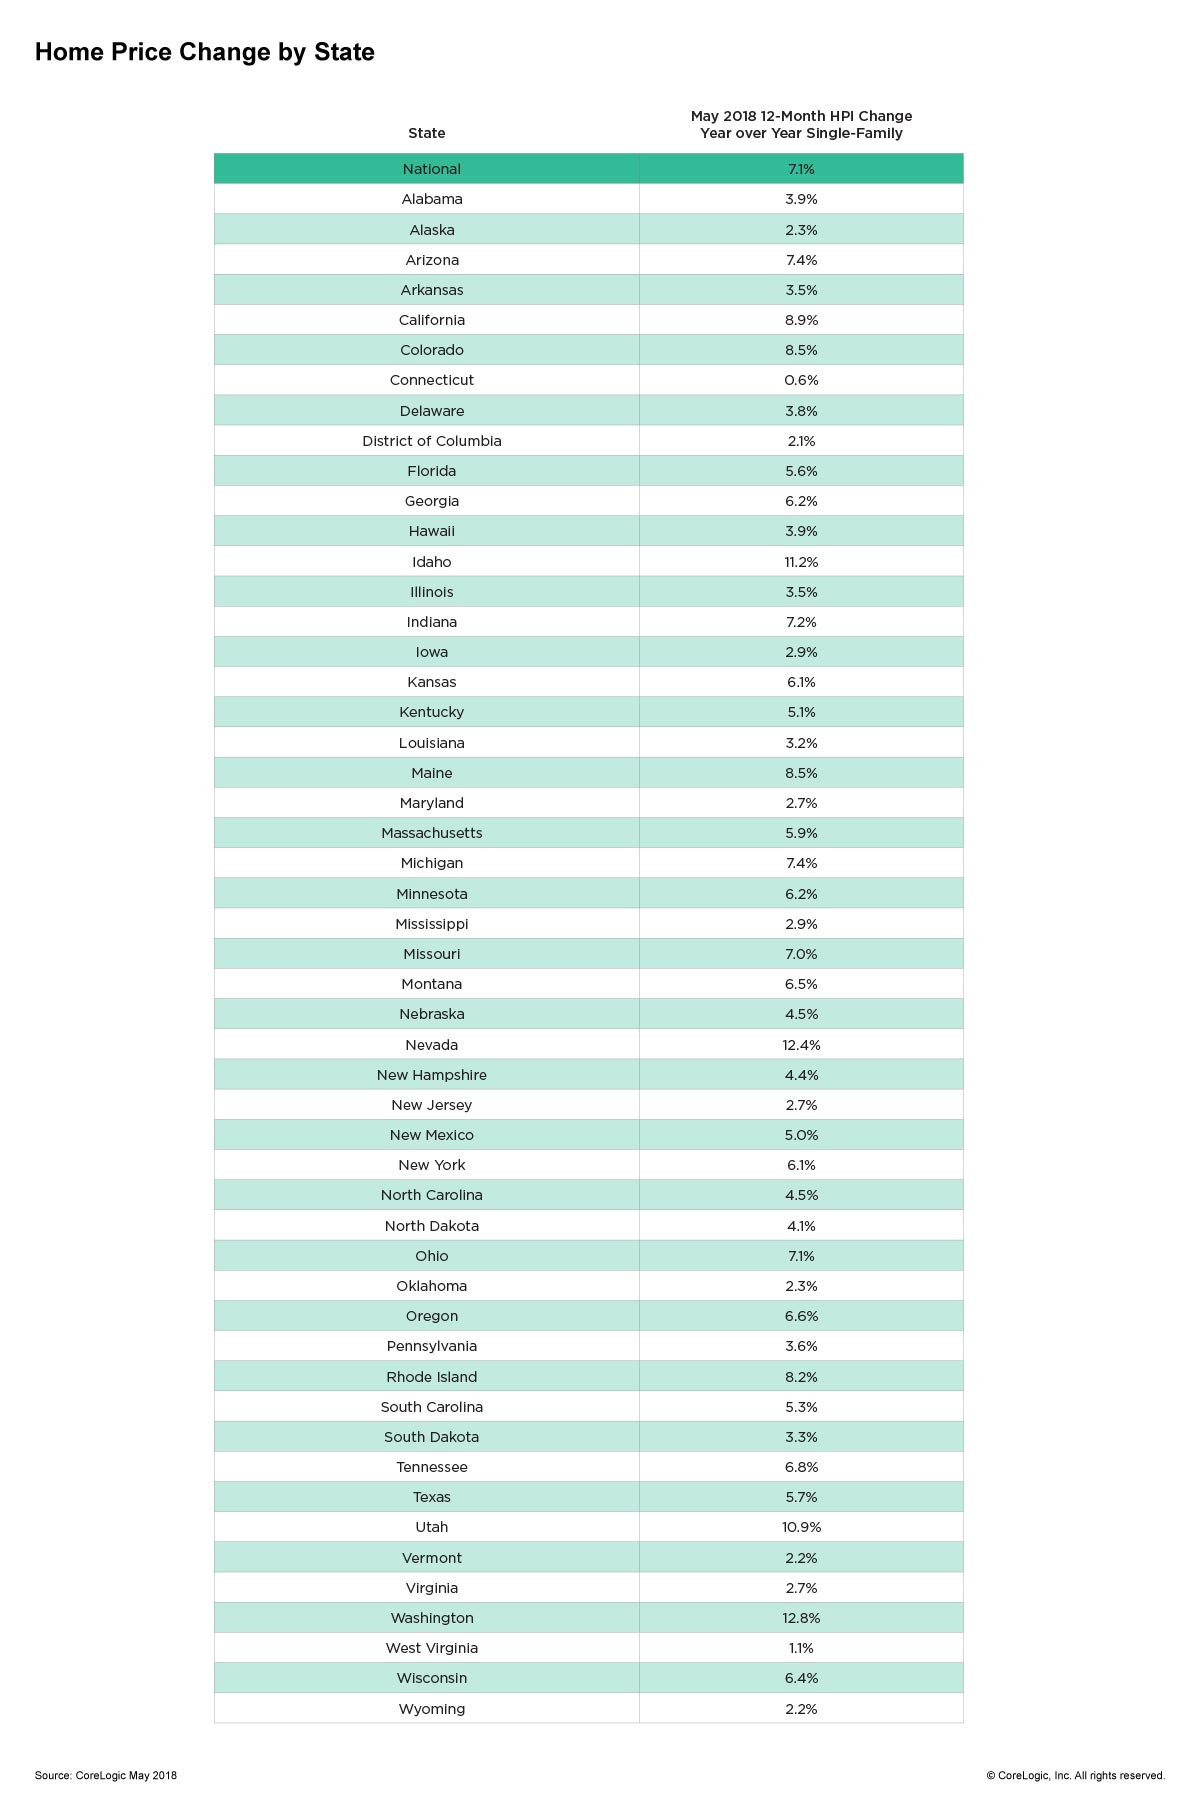
- Washington, Nevada, Idaho and Utah Post Double-digit 12-month Price Growth
- Home Prices Projected to Increase by 5.1 Percent by May 2019
CoreLogic (NYSE: CLGX), a leading global property information, analytics and data-enabled solutions provider, today released the CoreLogic Home Price Index HPI and HPI Forecast for May 2018, which shows home prices rose both year over year and month over month. Home prices increased nationally by 7.1 percent year over year from May 2017 to May 2018. On a month-over-month basis, prices increased by 1.1 percent in May 2018 – compared with April 2018 – according to the CoreLogic HPI. (April 2018 data was revised. Revisions with public records data are standard, and to ensure accuracy, CoreLogic incorporates the newly released public data to provide updated results each month.)
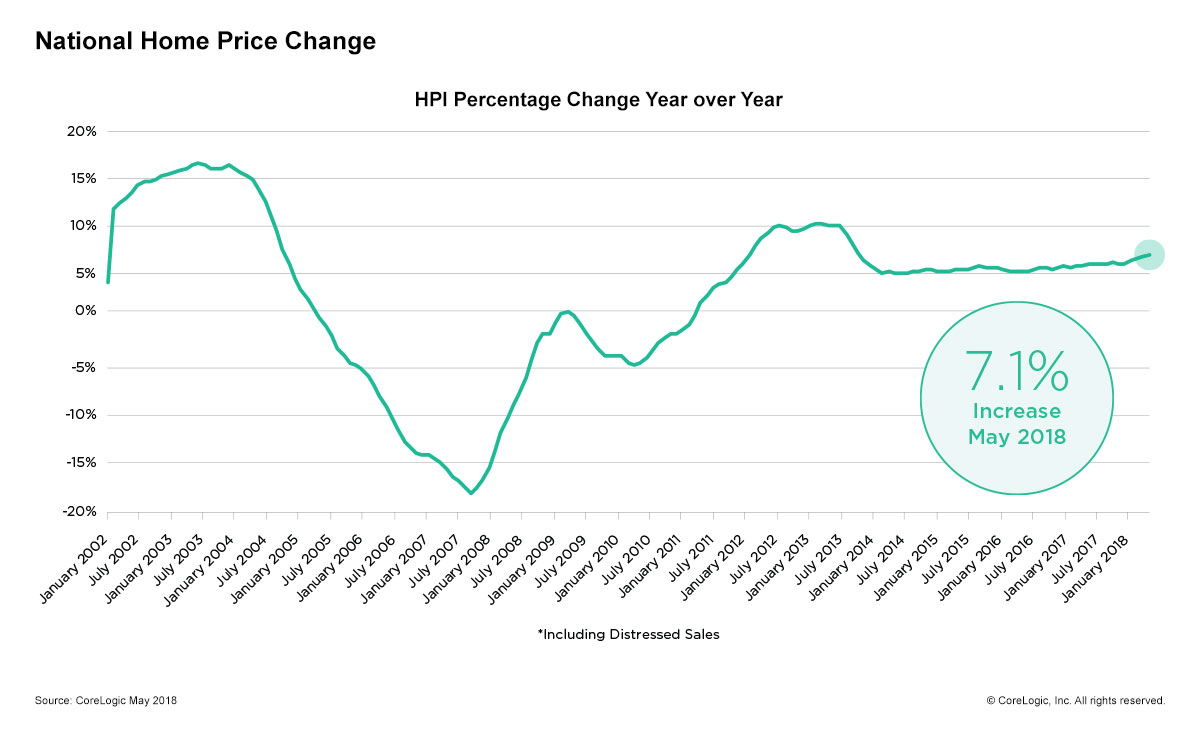
Looking ahead, the CoreLogic HPI Forecast indicates that the national home-price index is projected to continue to increase by 5.1 percent on a year-over-year basis from May 2018 to May 2019. On a month-over-month basis, home prices are expected to rise 0.3 percent in June 2018. The CoreLogic HPI Forecast is a projection of home prices that is calculated using the CoreLogic HPI and other economic variables. Values are derived from state-level forecasts by weighting indices according to the number of owner-occupied households for each state.
“The lean supply of homes for sale is leading to higher sales prices and fewer days on market, and the supply shortage is more acute for entry-level homes,” said Dr. Frank Nothaft, chief economist for CoreLogic. “During the first quarter, we found that about 50 percent of all existing homeowners had a mortgage rate of 3.75 percent or less. May’s mortgage rates averaged a seven-year high of 4.6 percent, with an increasing number of homeowners keeping the low-rate loans they currently have, rather than sell and buy another home that would carry a higher interest rate.”
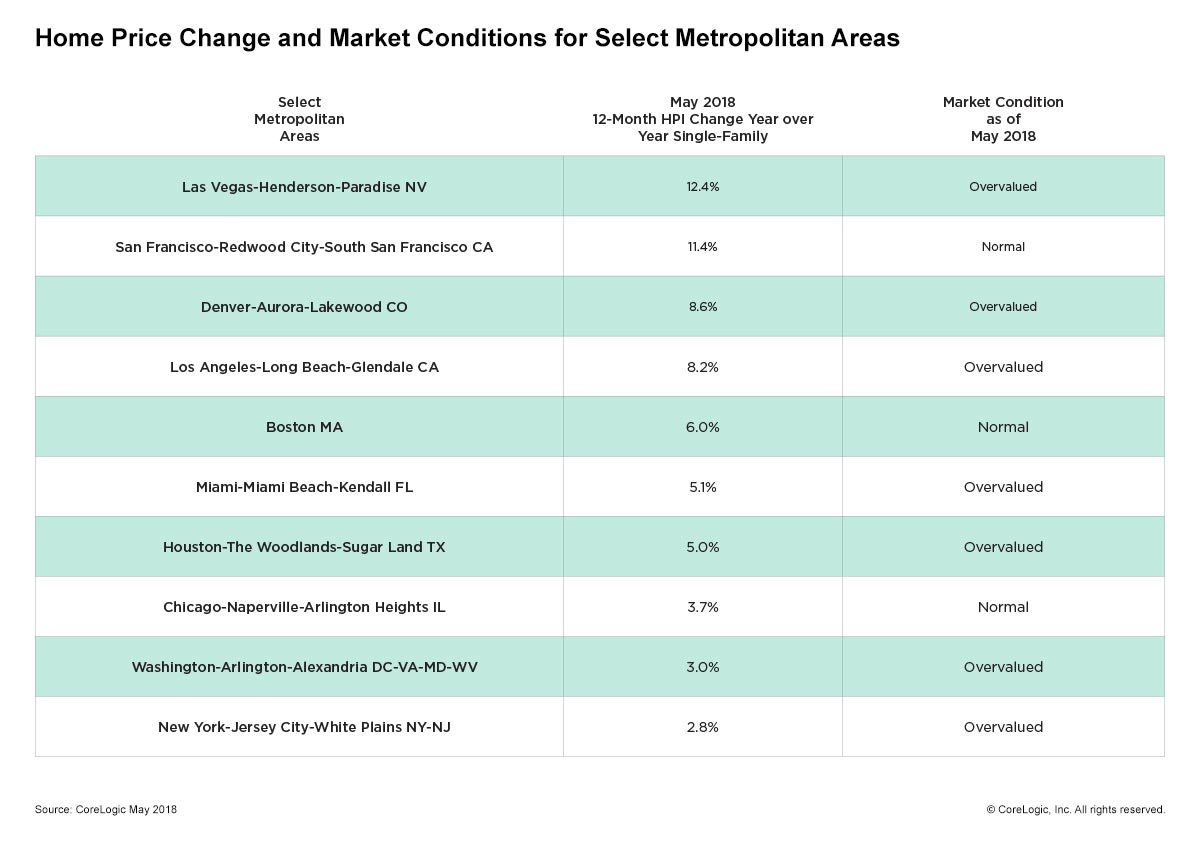
According to the CoreLogic Market Condition Indicators (MCI), an analysis of housing values in the country’s 100 largest metropolitan areas based on housing stock found that 40 percent of metropolitan areas have an overvalued housing market as of May 2018. The MCI analysis categorizes home prices in individual markets as undervalued, at value or overvalued, by comparing home prices to their long-run, sustainable levels, which are supported by local market fundamentals (such as disposable income). Additionally, as of May 2018, 26 percent of the top 100 metropolitan areas were undervalued and 34 percent were at value. When looking at only the top 50 markets based on housing stock, 52 percent were overvalued, 14 percent were undervalued and 34 percent were at value. The MCI analysis defines an overvalued housing market as one in which home prices are at least 10 percent higher than the long-term, sustainable level. An undervalued housing market is one in which home prices are at least 10 percent below the sustainable level.
In 2018, CoreLogic together with RTi Research of Norwalk, Connecticut, conducted an extensive consumer housing sentiment study, combining consumer and property insights. The study assessed attitudes toward homeownership and the drivers of the home buying or renting decision process. Across the U.S., 15 percent of homeowners and 28 percent of renters have indicated a desire to buy a home in the next 12 months, while only 11 percent have indicated a desire to sell.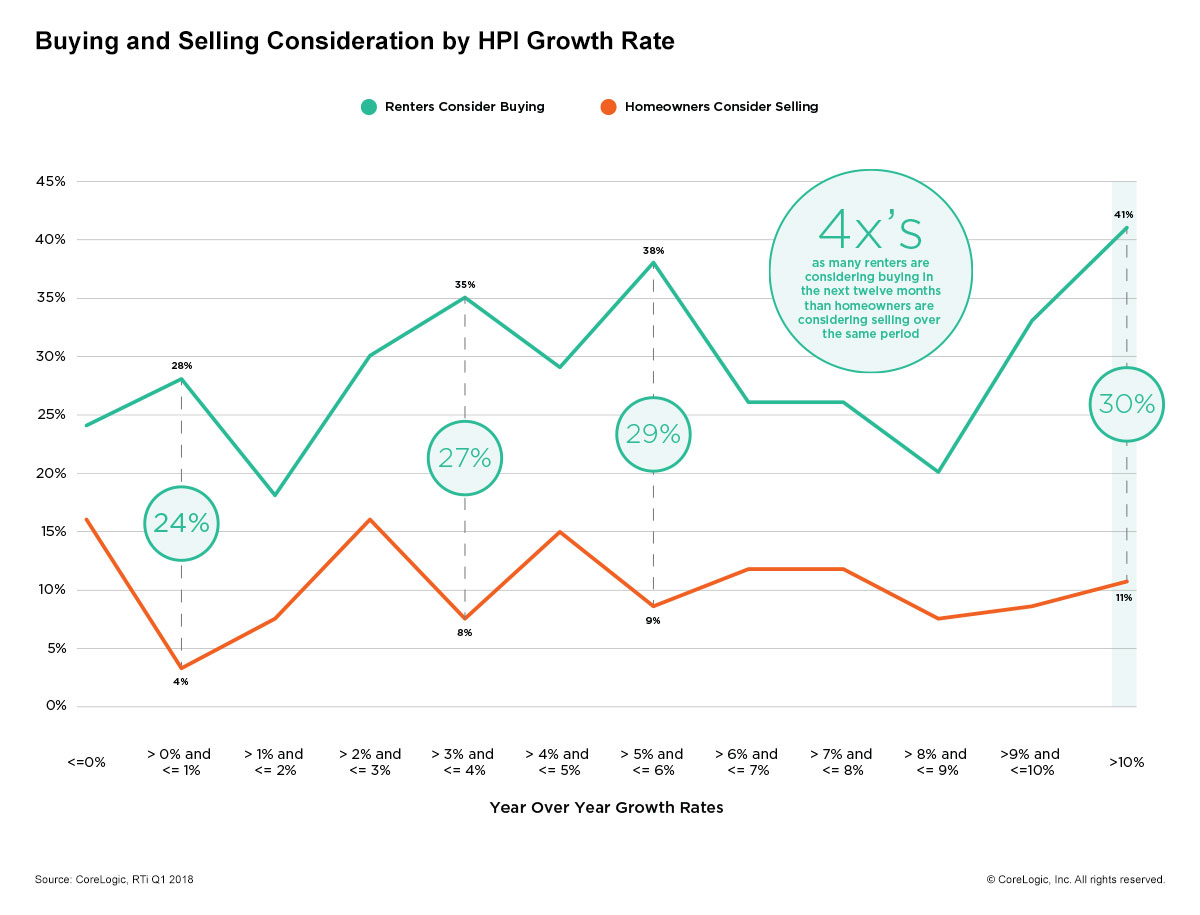
The research reported the long-term desire for homeownership is much stronger among renters in markets that have the highest home-price growth. Lagging supply in these markets is likely to continue as fewer current homeowners are considering putting their homes on the market. Over the next 12 months, 41 percent of renters are considering buying while only 11 percent of homeowners are considering selling over that same period. That is nearly four times as many renters than homeowners, which is the crux of the available housing-supply imbalance.
“The CoreLogic consumer research demonstrates that, despite high home prices, renters want to get out of their rental property and purchase a home,” said Frank Martell, president and CEO of CoreLogic. “Even in the most expensive markets, we found four times as many renters looking to buy than homeowners willing to sell. Until more supply becomes available, we will continue to see soaring prices in cities such as Denver, San Francisco and Seattle.”
Methodology
The CoreLogic HPI(tm) is built on industry-leading public record, servicing and securities real-estate databases and incorporates more than 40 years of repeat-sales transactions for analyzing home price trends. Generally released on the first Tuesday of each month with an average five-week lag, the CoreLogic HPI is designed to provide an early indication of home price trends by market segment and for the “Single-Family Combined” tier, representing the most comprehensive set of properties, including all sales for single-family attached and single-family detached properties. The indices are fully revised with each release and employ techniques to signal turning points sooner. The CoreLogic HPI provides measures for multiple market segments, referred to as tiers, based on property type, price, time between sales, loan type (conforming vs. non-conforming) and distressed sales. Broad national coverage is available from the national level down to ZIP Code, including non-disclosure states.
CoreLogic HPI Forecasts(tm) are based on a two-stage, error-correction econometric model that combines the equilibrium home price-as a function of real disposable income per capita-with short-run fluctuations caused by market momentum, mean-reversion, and exogenous economic shocks like changes in the unemployment rate. With a 30-year forecast horizon, CoreLogic HPI Forecasts project CoreLogic HPI levels for two tiers – “Single-Family Combined” (both attached and detached) and “Single-Family Combined Excluding Distressed Sales.” As a companion to the CoreLogic HPI Forecasts, Stress-Testing Scenarios align with Comprehensive Capital Analysis and Review (CCAR) national scenarios to project five years of home prices under baseline, adverse and severely adverse scenarios at state, Core Based Statistical Area (CBSA) and ZIP Code levels. The forecast accuracy represents a 95-percent statistical confidence interval with a +/- 2 percent margin of error for the index.