How quickly will higher mortgage rates impact the surprisingly resilient home buyers this spring? The interest on a 30-year fixed mortgage is approaching 7% again. Just a few weeks ago, the rates had dropped to under 6%. The rate’s almost 100 basis point move has a significant impact on payments and affordability. This change means there will be fewer buyers in the market.
The question is, where in the data do we see fewer homebuyers first? How long will it take for the higher mortgage rates to force the buyers to back off?
Pending sales and homes under contract
Fewer homes went into contract this week as new pending sales. Buyers who have been active in the market already this year could be thinking, “Since rates jumped from 6-7% maybe I’ll wait to see if they fall back down before I lock in my payment.”
As the homebuyer mindset shifts, there will be fewer homes taking offers and going into contract. That shift is visible in the first data point in the pending sales data this week.
There are 6% fewer pending sales this week. Altos tracked 55,000 single-family homes that transitioned from active listings to homes under contract this week. That number is down from 58,000 homes last week. This is one data point, but if you look for signs that homebuyers react to a sharp increase in mortgage rates, this is where you’d see it.
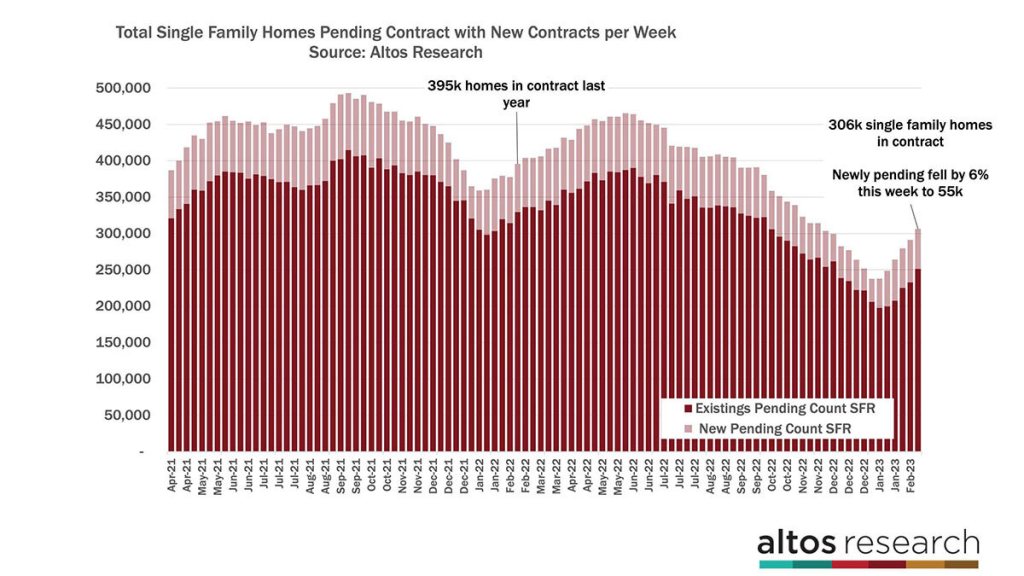
If your potential mortgage payment jumps big in one week, then maybe you hold off and don’t make the offer. Remember, this is the opposite of what was happening in February 2022. Back then, rates were still in the 3% range, but the rates were obviously headed higher. In early 2022, buyers knew they had to accelerate their offers. Now, buyers are waiting for the right moment.
In this chart, each bar represents a week with the total count of single-family homes that are in the contract pending stage. The taller the bar, the more homes were in contract. These are the homes that were listed for sale, took and accepted an offer and are now in the 30-60 day window between the offer and a closed sale. The light portion of the bar represents those homes that are newly pending each week.
A difference of 6% in the light portion of the bar may be hard to see from this perspective, but it is there. This change is notable because new pending sales have been increasing each week in 2023 so far.
The total number of homes in contract continues to climb. 306,000 single-family homes are in the pending stage right now. Use the chart above as a leading indicator of home sales across the country.
These sales will close in March and April. At the right end of the chart is the steady recovery in the number of home sales that we’ve had since the very low start to 2023. It’s the spring, so even if this recovery pace slows due to higher mortgage rates, the total homes in contract will keep climbing through June because there are just more transactions. Again, this trend is notable because it’s more than seasonal buying habits. It’s a recovery from the fall of 2022.
While this week there were slightly fewer new pending sales, there were also fewer completed sales. The total amount of pending sales continues to climb higher. Last week, there were 23% fewer homes in contract than there were at the tail end of the buying frenzy in 2022. So, if a contract fails and the home gets relisted for sale, that data point will come off this chart and will be counted back on the active inventory chart.
Inventory
Active inventory is still falling each week. Available inventory of single-family homes for sale in the U.S. fell by 1.5% this week to 436,000. Sellers are hard to find in this market. We have some demand and few sellers, so inventory is falling.
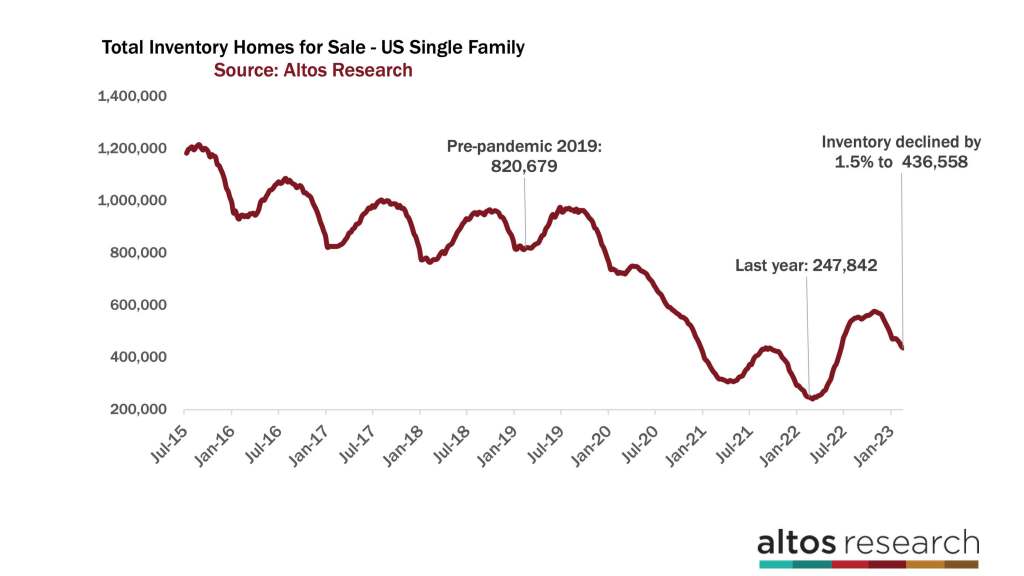
The weekly inventory decline is slowing, meaning supply demand imbalance is improving as we get into spring. I estimate that there will be two more weeks before we see the low point of inventory for 2023. If inventory keeps falling into March, that would be the next surprising development of an already surprising new year in housing.
In 2019 and earlier, inventory would be climbing by this point of the year. I’ve highlighted 2019 in the chart above. The low point of inventory in 2019 was earlier in January and again in early February. By this point in February 2019, inventory had been climbing for a few weeks and there were over 820,000 single-family homes on the market. Almost twice what is available for buyers today. There used to be much more supply and it would be growing by now. I expected this year to behave much more like 2019 than 2022, but I was simply wrong.
There were only 55,000 single-family homes newly listed for sale this week. That’s 24% fewer than in 2022 at this time. In 2022 there were also more bidding wars and immediate sales. In 2022 there were not many sellers but huge demand. This year there are even fewer sellers and modest demand. In the chart below, each bar is the total count of new listings in a given week. The light portion of the bar represents those homes that went into contract immediately after listing — the immediate sales.
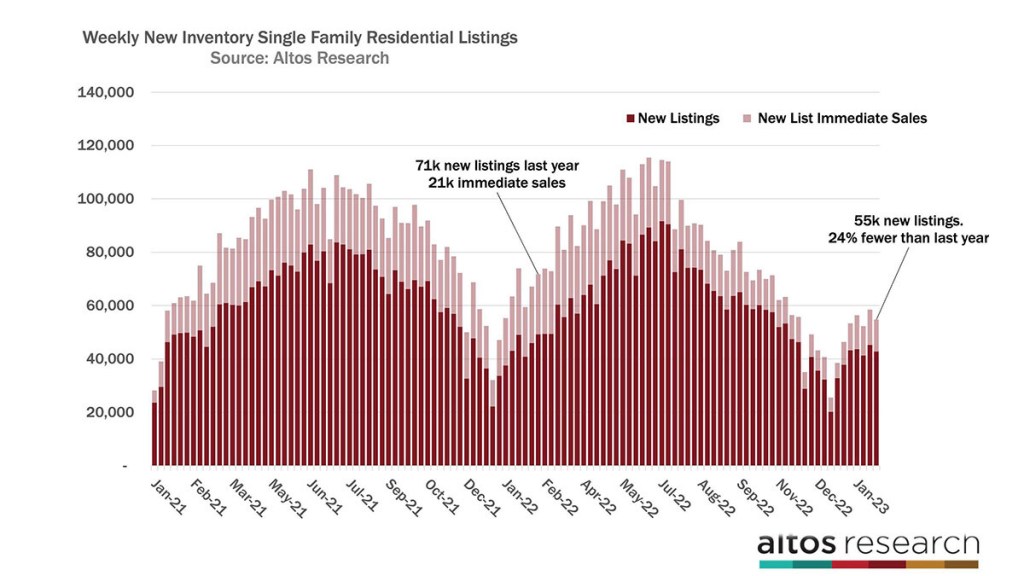
Homeowners in America are holding onto their ultra-cheap mortgages. Why sell the best financing deal ever? Even if I’m buying a new home, I’m not giving up the existing home that has a 2-3% mortgage. I think that’s what’s going on here. We can hypothesize that American homeowners are locked into their ultra-cheap mortgages and we can also see it play out in the data. At the right end of the chart, see how few home sellers come out each week.
Prices
We don’t yet know how 7% mortgage rates will affect demand this spring. There is plenty of buyer momentum, and we can see this trend in the price reduction data. Currently, 31.3% of the homes on the market across the U.S. have taken a price cut. This shows dramatic improvement in the relative levels of demand from 2022. See how steeply the dark red line is falling in the chart?
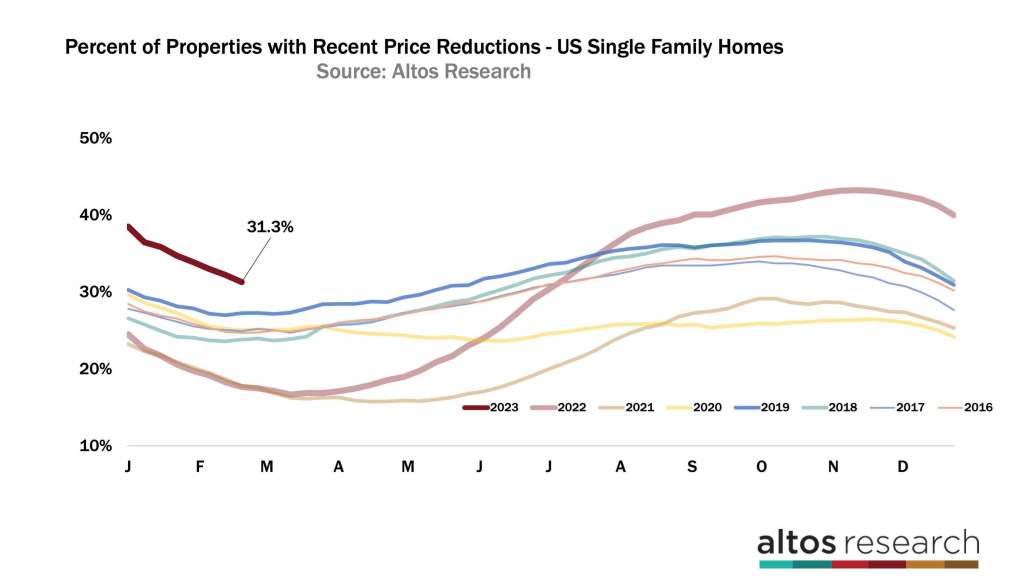
If the spring and summer of 2022 were notable for how quickly home sellers were cutting prices, the reverse is true now. The light red line is the curve from last year. In “normal” times, about a third of the market will take a price cut before the home sells. In recent years, March has seen the fewest price cuts because that’s when all the new inventory goes live, so as a percentage, fewer have taken a price cut. Then in Q2, if the home hasn’t sold, the price cuts data start climbing.
The last two years of housing market craziness meant that only 15% of the market took a price cut. There were bidding wars and insatiable demand. Then, in the summer of 2022, there was an abrupt change in demand. Buying and selling stopped cold. Now, we see the inverse happening.
There are more homes on the market now with price cuts than in any recent February. The slope of that curve in the chart shows us how quickly this market is returning to normal.
Now, what if rates stay at 7% or go higher? They could go higher because the economy keeps reporting such strong growth numbers on almost all fronts. So, watch price reductions as a gauge of how quickly demand gets cut off.
The dark red line will curve flat and then start rising. Does it get under 30%? Do we get back into this cluster of all the recent years? Or, will the trend reverse and head higher like last year?
One reason sellers don’t have to cut their price is that they’re starting at more reasonable asking prices. The median price of single-family homes in the U.S. this week is $419,900. That’s up a fraction of a percent from last week. Home prices always climb in February, but this year’s slope is very modest. In 2022, prices were spiking each week because sellers knew that buyer demand was strong. You can see the trajectory of the dark red line at the far right, it’s going to peak lower than last year’s peak. That pricing peak is almost always June 30th each year.
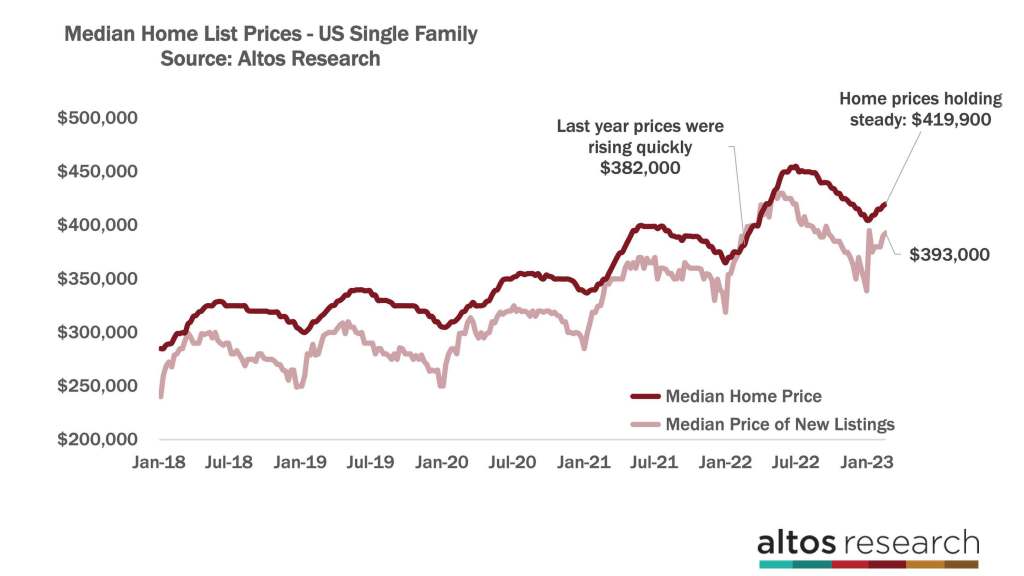
You can also gauge the future of home prices by watching the light red line. That’s the price of the newly listed cohort each week. The light red line is going sideways on the far right side of the chart. That represents home sellers telling us exactly where buyers are buying. At $393,000, the price of the new listings is essentially unchanged from a year ago. Home prices are already flat from a year ago. In the next few weeks, I expect the prices to drop below 2022 numbers.
Even as the supply-demand imbalance exacerbates the market, the demand is at very clear price points. Affordability is an important factor for home buyers, and you can see it playing out in the charts.